The democratisation of investing is pretty chaotic beautiful. Thanks to the bull run after the COVID crash, more than 7 crores new demat accounts have opened since 2019. But, how many of us are actually beating returns generated by MFs(or even FDs)? If not, then what are we missing? In the end, returns on MFs and FDs are also generated from the same market(let’s assume the debt/bond/commodity market is not a part of this discussion). In this three-part series, I am trying to figure out the same question.
Disclaimer/Attribution
I am not a SEBI certified analyst or someone with a finance background. I am a software engineer, trying to beat inflation without relying on the mercy of Mutual Fund Houses. All that I have learned is from my own research(from various sources) and experience(good and bad). And I am not recommending any specific stock or Fund via this series. Here is a list of resources and tools that I found useful out of all the ocean of misinformation.
- Sources: LLA, Varsity, SEBI, Rachana Ranade, r/IndianStreetBets, r/IndianStockMarket
- Tools: Moneycontrol, Screener, Chittorgarh, Gemini
Glossary/Important Concepts
Before we dive in, let’s cover some essential market jargon. If you already know the basics, feel free to skip to next section.
Market: A place where buyers and sellers come together to trade something.
Equity / Share / Stock: The smallest piece of ownership in a company. When you buy one share of Reliance, you own a small fraction of the company, from its oil refineries to its data centers.
Debt: Opposite of equity. You basically act like a bank to a company or the government and lend them money for a fix interval of time. In return, they promise to pay you back with interest. This is a bit safer then equity(as long as the borrower doesn’t go bankrupt) but comes with a lower return.
Bond/Debenture: It’s a contract where the borrower(a company/government) promises to pay you a fixed amount of interest(coupon) at regular intervals and then return your original amount(principal) on a specific future date(maturity).
G-Sec: Government Security - A bond issued by the Government of India. It’s considered the safest possible investment in the country because it’s backed by the government itself, which can always(not always) print more money to pay you back. They are the benchmark for risk-free returns. It is also known as a Treasury Bond.
T-Bill Treasury Bill - A short-term G-Sec. While G-Secs (bonds) can be for 10, 20, or even 40 years, T-Bills are for 91 days, 182 days, or 364 days.
Mutual Fund: The thing I mentioned we are trying to beat. It’s a basket of stocks managed by a professional(Fund Manager). Instead of you picking 50 stocks, you give your money to the Fund House(most probably in fixed periodic intervals known as SIP), and the manager invests it for you (and ~500,000 other people) in exchange for a small fee(expense ratio). The value of a Mutual Fund is determined by the value of the stocks in the basket and is known as Net Asset Value (NAV).
ETF: Exchange Traded Fund - It’s a again a basket of stocks (like a NIFTY 50 ETF), but instead of being bought/sold at a single end-of-day price, it trades on the stock exchange all day long. ETFs are passively managed and hence have a lower expense ratio compared to Mutual Funds. The value of an ETF is determined by demand and supply. Hence, the value of an ETF can be different from the commodity/stock it is tracking.
Derivatives: This is the high-stakes, advanced section of the market. You’re not buying the stock itself; you’re buying a contract that gets its value from an underlying asset.
Equity Marktes/ Share Markets/ Stock Markets: A market where shares of companies are traded. Just like stock markets, there are markets for debt and commodities as well.
Stock Exchange (NSE/BSE): The actual place where buyers and sellers come together to trade shares. The NSE (National Stock Exchange) and BSE (Bombay Stock Exchange) are the two main ones in India. Both are in Mumbai and are regulated by SEBI.
SEBI: Securities and Exchange Board of India is the regulatory body for the Indian equity market. They are responsible for protecting investors and making sure no one is rigging the game. The “Disclaimer” at the top is there to comply with their rules.
AMFI: Association of Mutual Funds in India is a trade group for/of the mutual fund companies(not a regulator). Its job is to promote the industry (you’ve probably seen its “Mutual Funds Sahi Hai” ads), set ethical standards for its members, and act as a link between the industry and the SEBI.
Bull Market: A period when stock prices are consistently going up. Everyone is optimistic, news anchors and market experts are busy in giving FOMO to the audience. Eveyone starts to believe that they have finessed the market and are geniuses. The post-COVID rally was a classic bull run.
Bear Market: The exact opposite. This where the bubble bursts. Entire segments are consistently falling. Everyone is pessimistic, news is all doom and gloom, and people are deleting apps to avoid seeing heavy losses. The same experts are now predicting the new lows every week. This is when fortunes are lost and the best buying opportunities appear. 2008-2010 & 2024-2025 were classic bear markets.
Sideways Market: A period when stock prices are fluctuating within a range. This is when the market is indecisive and is not sure which way to go. This is when the market is in a consolidation phase. As of now, the market is in a sideways phase.
Green means good, red means bad In stock market green means up and red means down. You’ll see this on charts, CMP, and the scrolling ticker tape. A sea of green suggests a bullish market and vice-versa. This is reversed in China, where red signifies profit (up) and green signifies loss (down). This is because red is a auspicious color in Chinese culture. So, I guess there is an intersection on the Venn diagram of communism and religious dogma. But then again, that’s probably been the case forever.[1][2][3]
Investor / Trader: Someone who invests in the market. In market lingo, these are terms are used in differently.
- An Investor is someone who buys and holds for a long term. They typically focus on fundamental analysis to find good businesses,
- A Trader is someone who buys and sells frequently to make profits in the short term. They rely heavily on technical analysis (charts and patterns) to time their entry and exit.
Promoter: Think of this as the founder, the founding family, or the core group that started the company (e.g., the Tatas for Tata Group, the Ambanis for Reliance, the Damanis for D-Mart, the Adanis for Adani Group). Their percentage of ownership (“promoter holding”) is watched very closely.
- High Promoter Holding: This is common in family-owned businesses where the founders or their relatives are still heavily involved, as CEOs, Chairpersons or Directors in different companies of the group.
- Low/Zero Promoter Holding: This is a professionally-managed company that is run by an independent board(L&T, ICICI Bank, ITC). The top positions are held by long term employees or hired executives.
- Pledging of shares: This is a major red flag. It means the promoters have taken a personal loan and used their own company shares as collateral (a guarantee). If they default on the loan, the bank will dump those shares on the market, causing a massive crash in the stock price. This also indicates that the promoters have lost confidence in the company or are aware of some internal issue/scam which will get exposed in the next financial report.
Hedging: A fancy word for “insuring” your investment. It’s an advanced risk-management strategy. Imagine you own a lot of a stock and are worried it might fall. You could use F&O to place an opposing bet that makes money if the stock loses money. This way, the loss on your stock is “offset” by the gain from your hedge.
Asset: Anything the company owns that has value. This includes cash in the bank, its factories, its inventory (like unsold cars for Tata Motors), and even money owed by customers(trade receivables).
Liability: Anything the company owes to others. This is its debt—bank loans, money it owes to its suppliers, salaries it needs to pay, etc.
P&L: Profit & Loss Statement - This is the company’s “report card” for a period (like a quarter or a year). It’s a simple formula: Total Sales (Revenue) - Total Expenses (Costs) = Net Profit (or Loss). This is the first thing analysts check to see if the company is truly profitable or are they also generating revenue from interest earned on FDs.
Balance Sheet: This is a “snapshot” of the company’s financial health on one specific day. It’s based on a simple formula: Assets = Liabilities + Equity. It tells you what the company owns (Assets) and how it paid for them (either with debt/Liabilities or with its own money/Equity).
Financial Year: It’s the 12-month period a company uses for its accounting and taxes. In India, this runs from April 1st to March 31st. So, when you see “FY25,” it means the period from April 1, 2024, to March 31, 2025.
Correction: This is a technical term for when a stock or index drops 10%-20% from its recent peak. It’s seen as a normal part of the cycle, “correcting” the price after it ran up too fast.
Unrealized Gains/Losses: This is your “on paper” or “notional” profit or loss. If you bought a stock at ₹100 and its current price is ₹150, you have an unrealized gain of ₹50. If it dropped to ₹80, you have an unrealized loss of ₹20. There is a comment I read on r/IndianStreetBets - “If the profit is good for a screenshot, it is good enough for a sell order”.
Realized Gains/Losses: This is the actual profit or loss you lock in when you finally sell the stock. When you sell that ₹100 stock at ₹150, you have realized a gain of ₹50. This is the amount that gets credited to your account and would reflect in your tax returns.
Volume: The number of shares traded in a day.
Volatility: A measure of how wildly a stock’s price swings up and down.
Liquidity: How easy it is to buy or sell a stock without significantly affecting its market price. Large cap stocks have high liquidity.
LTP: Last Traded Price - The price at which the last trade was executed.
CMP: Current Market Price - The price at which the stock is currently trading.
Market Cap: The total value of a company’s outstanding shares.
- Large Cap: These are the giants of the stock market, they are the biggest companies (market cap > ₹20,000 Crores). They are generally considered safer, more stable, and less volatile, but their high-growth days are often behind them.
- Mid Cap: These are established businesses but still have significant room to grow (market cap ₹5000 - ₹20,000 Crores). They offer a balance between the stability of Large Caps and the growth-potential of Small Caps.
- Small Cap: These are the newest, smallest, and often unknown companies on the exchange (market cap < ₹5000 Crores). This is the “high risk, high reward” zone.
- The bands(<5000, <20000, ≥ 20000) are not fixed. You might see different bands in different sources and will change(hopefully upwards) over time.
- FlexiCap: A type of Mutual Fund. A FlexiCap fund manager has the flexibility to invest in any of the categories above, depending on where they see the best opportunities. PPFAS is a FlexiCap fund.
- Blue Chip: This isn’t a formal category, but a term used for the absolute best-of-the-best companies. A Blue Chip stock is one from a company that is large, financially sound, and has a long history of paying dividends and growing reliably (think Infosys, HUL, HDFC Bank). Blue Chips are generally large Caps, but not all large caps are considered blue chips.
Broker: You can’t buy shares directly from NSE/BSE. You need a registered broker (Zerodha, Groww) who gives you a trading platform, takes your orders, and executes them on the exchange.
Brokerage: The fee charged by the broker for executing your orders. It is usually a small percentage of the transaction value.
Demat Account: Dematerialised Account - A digital locker where all your shares are stored safely in electronic form.
CAGR: Compound Annual Growth Rate - A fancy term for the average return per year. This is what you use to measure the growth of a single, lump-sum investment over a specific period. Generally used to compare the returns of two stocks or any other financial instrument.
XIRR: Extended Internal Rate of Return - Another fancy term for average return per year. XIRR is what you use when you invest multiple amounts at different times. This is the correct way to calculate your actual portfolio return if you invest through an SIP or just buy shares whenever you have extra cash. Can be used to calculate returns on MFs, stocks, RDs, LIC policies, ULIPs, etc.
Fundamental Analysis: Figuring out what to buy. This involves reading a company’s financial reports, the quality of its management, its debt, its future plans, and its competition—to find its true value.
Technical Analysis: Figuring out when to buy. It largely ignores the fundamentals and focuses entirely on price charts and trading volumes. Technicians believe all the required information is already reflected in the stock’s price, and they use historical patterns and trends to predict where the price will go next.
Trading Hours
| Session | Time Window | Purpose |
|---|---|---|
| Pre-Opening Session | 9:00 AM - 9:15 AM | Order placement and matching phase |
| Regular Trading Hours | 9:15 AM - 3:30 PM | Main trading window for retail investors |
| Post-Market Session | 3:30 PM - 4:00 PM | Primarily for brokers to settle trades |
| After Market Orders (AMO) | 4:00 PM - 9:00 AM (next day) | Place orders when markets are closed |
Why Pre-Opening is needed
Imagine if markets opened directly at 9:00 AM. Overnight, major news breaks:
- Company announces fantastic results at 5:30 PM
- Or global markets crash while we’re sleeping
- Or RBI announces surprise rate cut on a weekend/holiday
Without pre-opening, big institutional traders (who monitor news 24/7) place orders instantly at 9:00 AM, while regular retail investors (you and me) are still processing the news. This results in stock opening at extreme price (very high or very low), and by the time you react, the opportunity is gone and you end up buying/selling at unfair prices.
How Pre-Opening saves retail investors
Phase 1: Order Collection (9:00-9:07 AM)
- Everyone places orders - institutions, retail traders, everyone
- No trades execute yet, just orders collected
- You have 7 minutes to process overnight news and place your order
Phase 2: Order Matching (9:08-9:11 AM)
- System runs an algorithm to find equilibrium price
- Calculates: “At what price can maximum shares be traded?”
- All buy and sell orders are matched at this SINGLE price
Phase 3: Buffer Period (9:12-9:15 AM)
- Opening price is displayed but frozen
- No new orders can be placed/modified
- Everyone can see where market will open
Outcome: Level playing field - your 9:02 AM order has same priority as institutional order. No one gets advantage, everyone gets same opening price.
Note: Pre-opening is like a “democracy vote” for opening price instead of a “fastest finger first” game. It protects small investors from being at a disadvantage against institutional players with faster systems and 24/7 news monitoring.
Settlement Cycle
Indian equity markets operate on a T+1 settlement cycle, where trades execute immediately but settlement occurs one working day later.
Settlement Examples:
- The “T” stands for Trade date, “+1” means add 1 working day
- Trade on Monday → Settlement on Tuesday
- Trade on Friday → Settlement on Monday (skips weekend)
Note: India moved from T+2 to T+1 settlement(and T+0 for select stocks) in January 2023, making it one of the fastest settlement cycles globally. Read more.
Types of Markets
| Feature | Primary Market | Secondary Market |
|---|---|---|
| Purpose | To raise fresh capital | To trade existing securities |
| Type of Offering | IPO (first-time) or FPO (additional capital) | Already-listed shares |
| Transaction Between | Company ↔ Investor | Investor ↔ Investor |
| Price Discovery | Book-building process | Market forces (demand & supply) |
Example:
- Primary Market: Zomato IPO (2021) - Company raised ₹9,375 Cr directly from investors. Money goes to the promoters of the company.
- Secondary Market: Buying Zomato shares on NSE - Money goes to the seller (and not Zomato)
IPOs
Lately, IPOs have become a very popular way to gain good returns in the short term without any risk (or research). Just follow the GMP and the subscription ratio to decide if you want to apply for the IPO. The fundamentals of a company can be bleaker than the future of women’s rights organisations in Afghanistan. The primary reason for the IPO could be to pay some bad loan or promoter’s pressure to exit. But as long as there is hype in the market for the IPO, you can expect a good return. I won’t say this is not true, but always make sure to categorize such investments in a completely different (isolated) bucket and never mix it with your long-term investments. Otherwise, you might end up holding the next Paytm or Nykaa.
Also, don’t give up when consecutive IPO applications are rejected. That is how any lottery system works. You will never get the winning ticket, while your brother, your friend, his brother, his brother’s friend will get it. Anyone and everyone will get it, except you. But still, iff you want to make this the art of picking IPOs a bit more scientific, you can use the following framework:
- Download the Red Herring Prospectus (RHPS) from the company’s website.
- Read the RHPS carefully and understand the business model and management of the company.
- Check the financials of the company and verify
- If the company is profitable.
- If the revenue is growing.
- Total assets are greater than total liabilities.
- PAT is healthy and consistent.
- Google the company and read the recent news articles about the company. Check for any recent scandals or controversies.
- Go on Chittorgarh and see the current GMP of the company. At minimum, it should be 10% above the upper band. Anything greater than 20% is a good sign.
- Check the subscription ratio. Once it crosses 3x, you can consider applying for the IPO.
Futures and Options
Since we are talking about “quick ways” to make money in the market, let’s discuss F&O. These are the contracts that allow you to trade in the market without owning the underlying asset. You’re essentially placing a bet on where that asset’s price will be in the future.
Futures
- A simple, binding contract where you agree to buy (or sell) an asset at a specific price on a specific future date. You don’t have a choice; you are obligated to follow through.
- It’s like a non-refundable order. You agree today to buy a bag of rice from a farmer next month for ₹1,000.
- If the price of rice shoots up to ₹1,500 by next month, the farmer is obligated to sell it to you for ₹1,000.
- If the price of rice crashes to ₹700, you are obligated to buy it from the farmer for ₹1,000.
- Loss/Profit: Both your potential profit and your potential loss are unlimited(theoretically).
- Margin (Initial Margin): The minimum amount of capital, required by the exchange, that a trader must deposit with their broker to open a futures position(both long and short).
Options
- A contract that gives you the right(not an obligation) to buy or sell an asset at a specific price (Strike Price) on or before a specific date (Expiry).
- Loss/Profit:
- For an Option Buyer, your loss is limited to the premium you paid, but your profit is unlimited(theoretically).
- For an Option Seller, your loss is unlimited if selling a Call, and substantial if selling a Put, as the stock can go to zero.
Call Option (CE)
- Gives you the right to BUY. Exercise this when you are bullish.
- It’s like paying a non-refundable booking fee(premium). You pay a farmer ₹50 today for the right to buy his bag of rice next month for ₹1,000 (strike price).
- Scenario 1: The price of rice shoots up to ₹1,500. You use your right, buy the rice for ₹1,000. Your net profit is ₹450, because you gained ₹500 but paid a ₹50 fee.
- Scenario 2: The price of rice crashes to ₹700. You just let your right expire. You don’t buy the rice for ₹1,000. Your loss is limited to the premium you paid.
Put Option (PE)
- Gives you the right to SELL. Exercise this when you are bearish.
- This is like buying insurance. You pay a small premium for the right to sell your stock at a guaranteed “safe” price, even if the market crashes.
Warning: Don’t get involved with F&O unless you know what you are doing. This is the riskiest(and the most biased) instrument in the market for retail investors. In contrary to popular belief, F&O is not meant for speculative trading. It should be used for hedging against market uncertainties. More than 90% of retails investors lose money in F&O segment. Lastly, if you are a student(or
unemployedhustler), most probably you won’t earned have the required funds(lot size is comparatively high) to trade in F&O. So, please don’t “invest” your tution fee/rent because of some tip on social media. If you want to have some fun, start an SIP in a high risk fund or some small-cap companies with good fundamentals.
Short Selling
As the name suggests, short selling is when you sell a stock that you don’t own. You borrow the stock from a broker and sell it. You then buy the stock back(hopefully at a lower price) and return it to the broker. The delta between these amount is your profit/loss.
The Process
- Tuesday 5 PM - HDFC’s latest financial results show a 10% drop in profit from the last quarter. You currently have no HDFC shares in your demat account.
- Wednesday 9:12 AM - You think HDFC Bank (CMP = ₹1,600) will fall today
- You sell first - Sell 1000 shares @ ₹1,600 (you don’t own them yet)
- HDFC falls - Price drops to ₹1,550 by afternoon
- You buy back - Buy 1000 shares @ ₹1,550
- Your profit - ₹50 per share * 1000 shares = ₹50,000
Critical Rules
- Must square off same day(before 3:30 PM)
- If you forget to buy back, shares go to auction market (3:30-4:00 PM)
- Any loss = You will have to pay
- Any profit = Goes to IEPF and not you.
Warning: Short selling is risky - losses can be huge if stock rises sharply.
Investor Categories
| Category | Full Form | Threshold/Definition | Examples |
|---|---|---|---|
| RII | Retail Individual Investors | Investment < ₹2 lakhs in IPOs | You, me, salaried professionals, small traders |
| HNI | High Net Worth Individuals | Investment > ₹2 lakhs in IPOs | Business owners, wealthy individuals, family offices |
| DII | Domestic Institutional Investors | Indian institutions managing pooled money | SBI Mutual Fund, LIC, HDFC AMC, ICICI Prudential, UTI |
| FII/FPI | Foreign Institutional/Portfolio Investors | International investors bringing foreign capital | Government of Singapore, Europacific Growth Fund |
Types of Orders
| Order Type | What It Is | Example | Risk/Note |
|---|---|---|---|
| Market Order | Executes immediately at current market price | Reliance at ₹2,500 → Order executes at ₹2,499-₹2,501 | Slippage - actual price may differ from screen price in volatile markets |
| Limit Order | You set maximum buy price or minimum sell price | TCS at ₹3,500, you place limit at ₹3,450 → Executes only if TCS drops to ₹3,450 or below | May never execute if price doesn’t reach your limit |
| Stop Loss Market | Safety net - auto sells if price falls to trigger | Buy at ₹1,600, trigger at ₹1,520 → Hits ₹1,520 → Sells immediately at market | Execution guaranteed but final price uncertain (could be ₹1,520 or ₹1,515) |
| Stop Loss Limit | Safety net with price range control | Trigger ₹95, Limit ₹93 → Hits ₹95 → Sells only between ₹95-₹93 | If price crashes past your limit instantly (₹95→₹92), order won’t execute |
| IOC (Immediate or Cancel) | Execute now or cancel completely | Want to buy 1,000 shares, only 300 available → Gets 300, cancels 700 | All-or-nothing execution at current moment |
| GTC (Good Till Cancelled) | Order stays active until filled or manually cancelled | Place limit order on Monday → Stays active till Friday or until you cancel | Remember to cancel manually or it stays indefinitely |
| Disclosed Quantity | Large order showing only small portion to market | Want 10,000 shares but show only 500 at a time | Prevents tipping off other traders about your big position |
Gap Opening
Markets rarely open exactly where they closed. After-market orders accumulate overnight, creating supply-demand imbalances.
Gap Up Opening - Opening price exceeds previous close, indicating positive overnight sentiment.
Gap Down Opening - Opening price falls below previous close, signaling negative overnight news.
Circuit Breakers
Price band limits preventing extreme single-day volatility, typically set at 5%, 10%, or 20% bands.
Common Circuit Limits:
- 5% circuit - Large-cap stocks
- 10% circuit - Mid-cap stocks
- 20% circuit - Small-cap and volatile stocks
Market-Wide Circuit Breakers (Index Level)
Beyond individual stocks, the NSE and BSE also have circuit breakers that halt ALL trading when indices fall/rise sharply.
| Change from previous day’s close | Action | Trading halt duration |
|---|---|---|
| 10% change | 🟡 Level 1 Circuit | 45 minutes |
| 15% change | 🟠 Level 2 Circuit | 1 hour 45 minutes |
| 20% change | 🔴 Level 3 Circuit | Rest of the day |
Instances when market circuit breakers were hit
2009 Lok Sabha Election Results
- Impact: SENSEX locked at 14,272.62(+17.24%), NIFTY locked at 4,308.05(+17.33%).
- Reason: UPA II returned to power with better majority, no more dependency on the Left.
COVID-19 Crash (March 2020)
- Impact: SENSEX crashed 13.15%, NIFTY down 12.98%. Level 2 (15%) circuit breaker triggered
- Reason: Global pandemic panic, nationwide lockdown announced
Harshad Mehta Scam (1992)
- Impact: SENSEX plunged 12.77%
- Reason: Securities scam exposure, massive manipulation uncovered
Global Financial Crisis (2008)
- Impact: 10%+ crashes on multiple days
- Reason: Lehman Brothers collapsed, global banking crisis
Note: Circuit breakers protect the entire market from panic selling or euphoria. They give investors time to think rationally rather than panic selling/buying. Sharp rallies are often followed by equally sharp corrections.
Face Value
Face Value: Nominal value printed on share certificate used for calculations in corporate actions. It is fixed when the company issues shares (typically ₹1, ₹5, or ₹10) and only changes through stock splits/consolidations. Dividends, rights ratios, and preference share coupons are declared as a percentage of face value.
Market Value: Current trading price determined by supply-demand dynamics.
Example: MRF face value = ₹10, market value = ₹1,55,000+
Market Capitalisation
Market Cap = Total Outstanding Shares × Current Market Price
Free Float Market Cap
It is the total market value of a company’s shares that are available to be traded by the public. Index calculations use free float, not total market cap as total market cap also includes shares held by promoters.
| Component | Value | Explanation |
|---|---|---|
| Total Shares | 1,00,00,000 | All shares issued by company |
| Promoter Holding | 60% | Locked with founders/promoters |
| Public Holding | 40% | Available for trading |
| Freely Floating Shares | 40,00,000 | Only these count |
| Market Price | ₹500 | Current trading price |
| Free Float Market Cap | ₹200 Crores | 40,00,000 × ₹500 |
Note: Higher free float = Better liquidity
Market Indices
Market indices are used to track the performance of markets in a particular country or segment. Rising/falling indices are a good indicator of the overall market sentiment. However, you should not rely on indices alone to make investment decisions. In the last financial year, NIFTY dropped by more than 10%, while companies like InterGlobe(IndiGo), Airtel, Paytm and many more gave superb returns.
| Index | Country | Description |
|---|---|---|
| NIFTY 50 | India(NSE) | Top 50 companies across sectors |
| SENSEX | India(BSE) | Top 30 established companies |
| MCX iCOMDEX | India(MCX) | Commodity Index tracking futures contracts (metals, energy) on the MCX |
| India VIX | India | A volatility index that measures market fear/uncertainty |
| DOW | USA(NYSE) | 30 large, influential blue-chip companies |
| S&P 500 | USA | 500 of the largest US companies (key benchmark) |
| NASDAQ 100 | USA(NASDAQ) | 100 largest non-financial (mostly tech) companies |
| FTSE 100 | UK(LSE) | 100 largest companies on the London Stock Exchange |
| CAC 40 | France(Euronext) | 40 largest companies on Euronext Paris |
| DAX | Germany | 40 largest companies on the Frankfurt Stock Exchange |
| CSI 300 | China | Top 300 A-share stocks from Shanghai & Shenzhen |
| Hang Seng | Hong Kong | ~80 largest companies on the Hong Kong Stock Exchange |
| Nikkei 225 | Japan | 225 top-rated companies on the Tokyo Stock Exchange |
Tax Implications
Let’s understand how profits are taxed depending on the holding period.
| Type | Holding Period | Tax Rate |
|---|---|---|
| LTCG | > 1 year | 12.5% |
| STCG | ≤ 1 year | 20% |
| Dividend | N/A | Added to your income(taxed at slab rate) |
A simple example to understand this better.
| Purchase Date | Sale Date | Shares | Purchase Price | Sale Price | Profit | Tax Rate | Taxed Amount | Net Profit |
|---|---|---|---|---|---|---|---|---|
| Oct, 2025 | March, 2026 | 100 | ₹1,000 | ₹1,100 | ₹10,000 | 20% | ₹2,000 | ₹8,000 |
| Oct, 2025 | Dec, 2026 | 100 | ₹1,000 | ₹1,090 | ₹9,000 | 12.5% | ₹1,125 | ₹7,875 |
From the above example, we can see that the government incentivises long term investment by providing lower tax rates. But you should not take this as a reason to hold on to the stock for the long term.
Corporate Actions
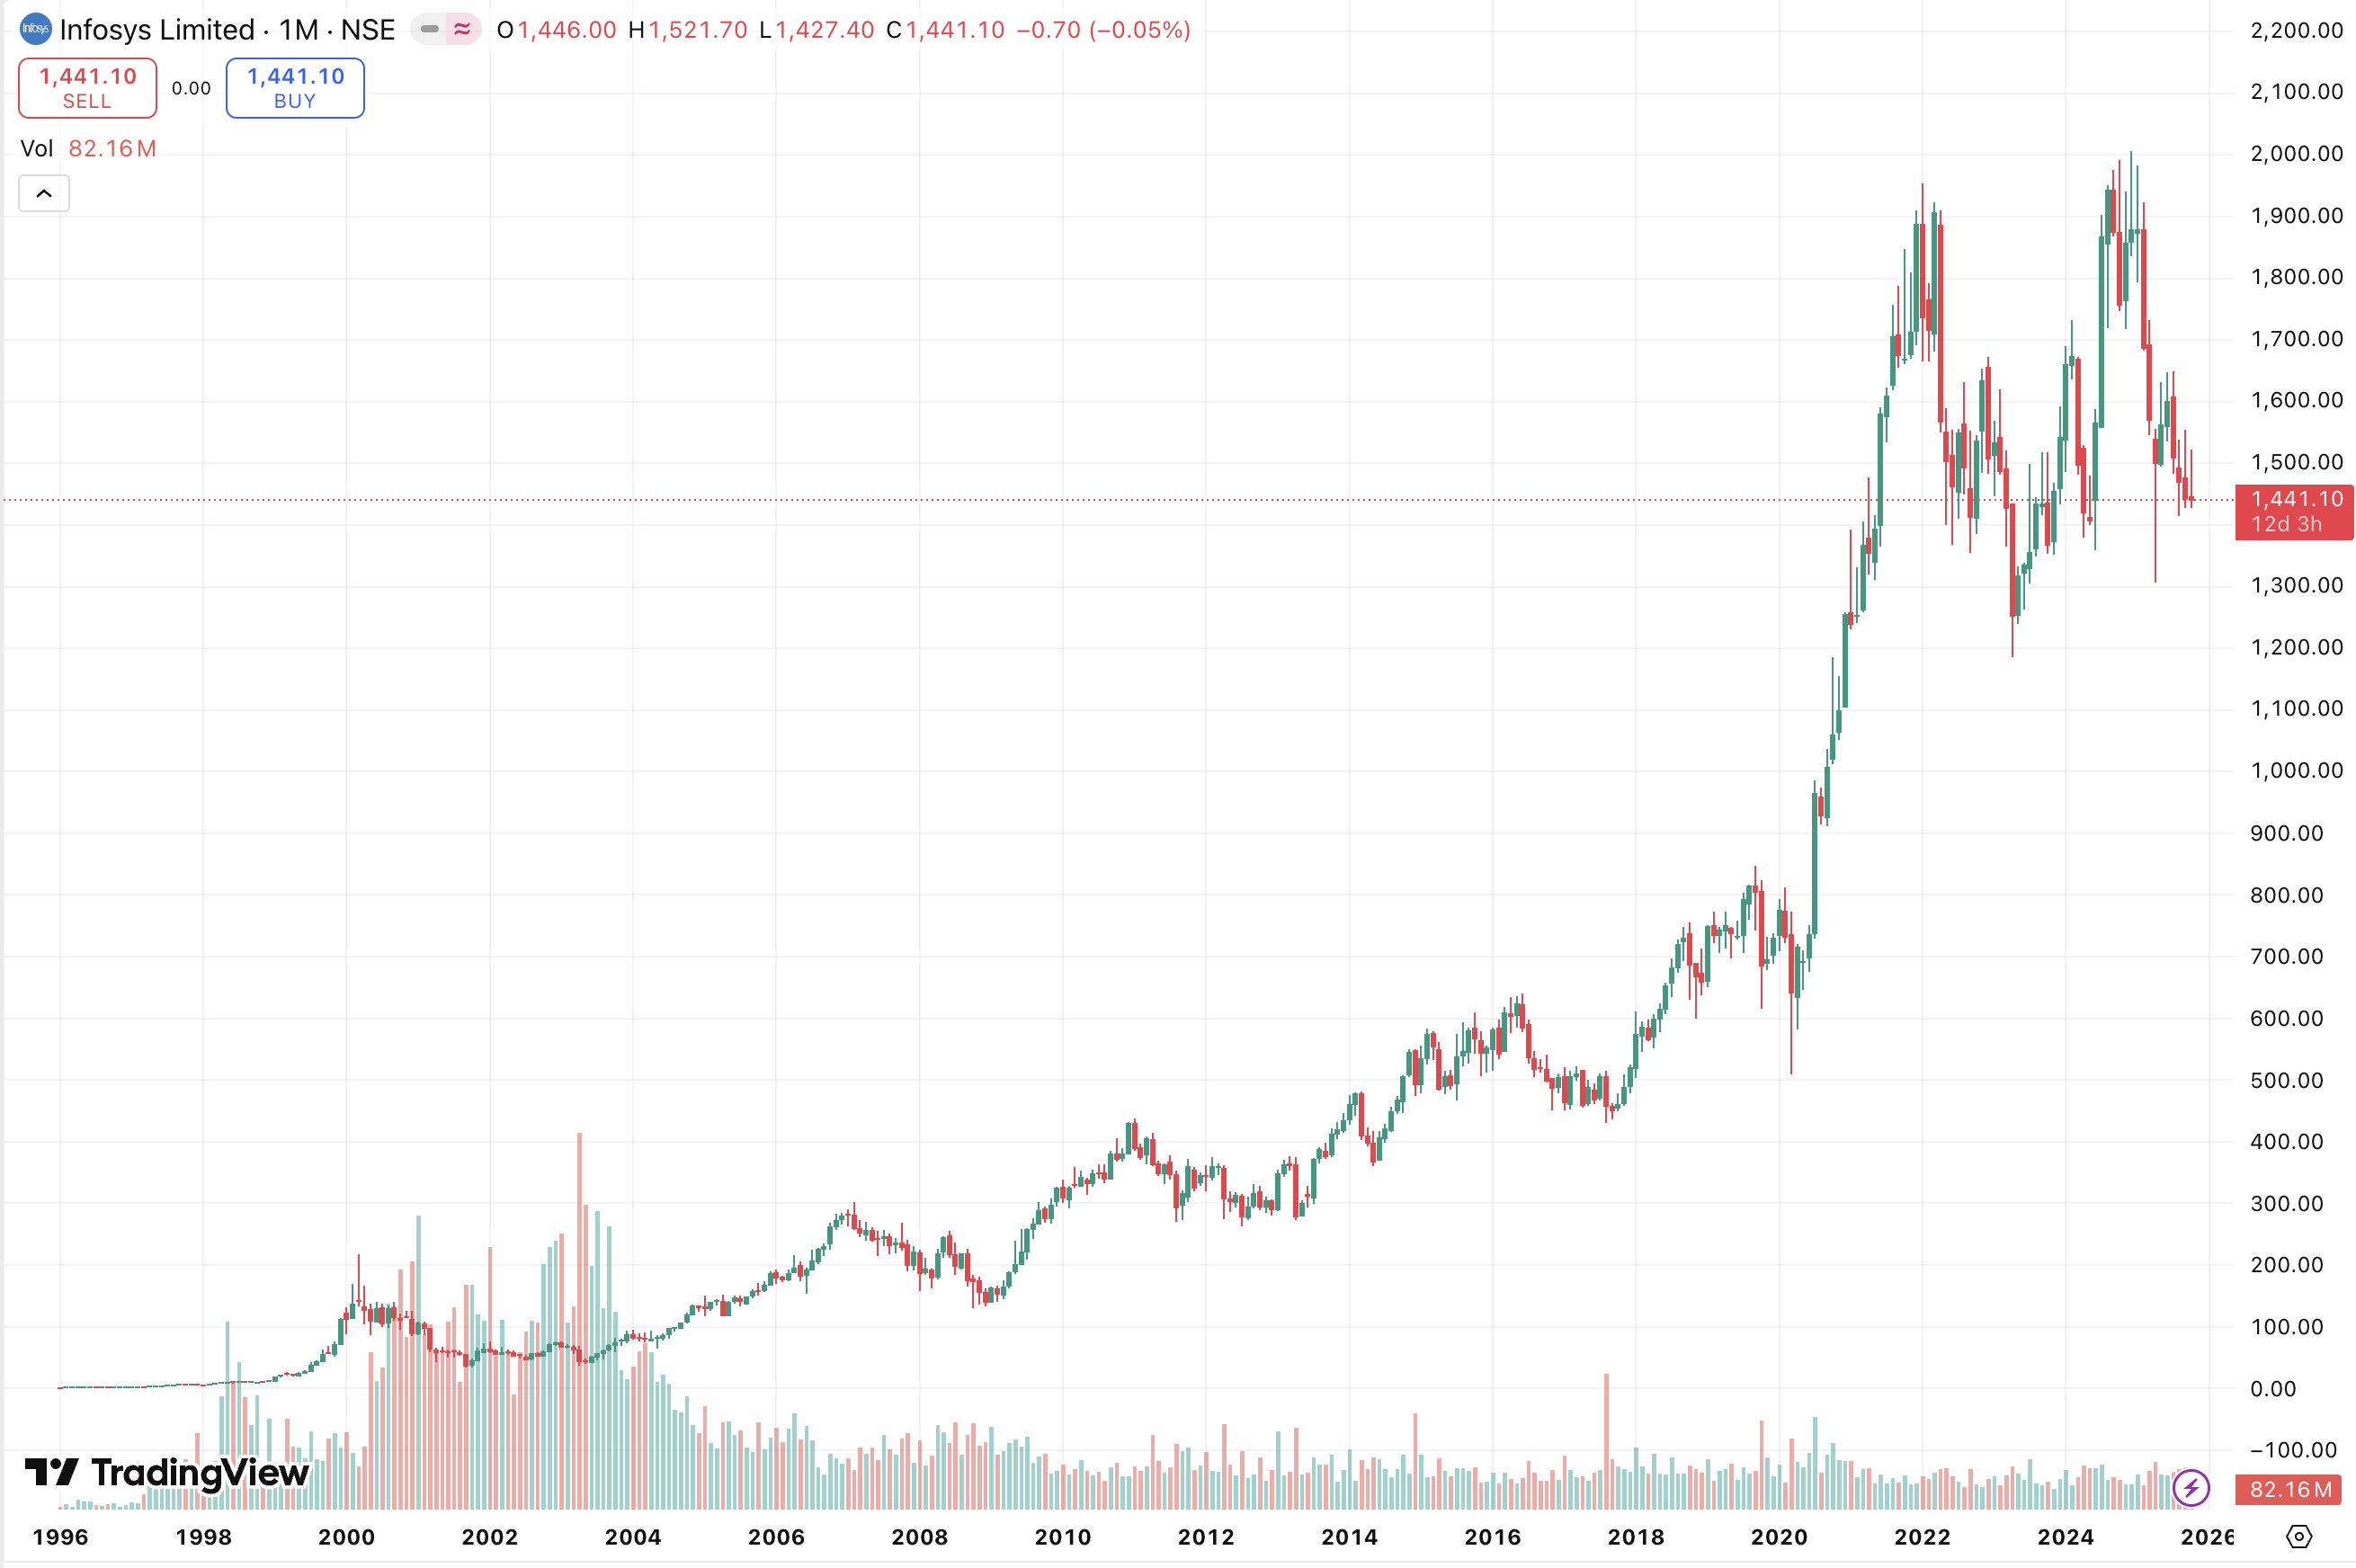
The chart above shows Infosys stock price growing from ₹95 to ₹1,500 over 30 years—a 15x return on paper. However, this only reflects price appreciation and ignores the massive impact of corporate actions like stock splits and bonus issues that multiplied shareholders’ actual holdings.
Dividends
It is the distribution of profits to shareholders based on face value(not market value). You can assume this as ‘interest’ earned on your long term investment.
Important terms
- Announcement Date: Corporate action declared by the board of directors.
- Record Date: Shareholders on this date receive benefits
- Ex-Date: Trades after this date don’t qualify for announced benefits
- Ex-Dividend (“Excluding Dividend”): This describes a stock on or after the ex-dividend date. If you buy the stock now, you are buying it without the right to the dividend.
- Cum-Dividend (“With Dividend”): This describes a stock in the period before the ex-dividend date.
- Dividend Yield: The percentage of the current stock price that is paid out as dividends.
- Interim Dividend: A dividend paid out during the financial year, usually after half-year financial results.
- Final Dividend: A dividend declared at the end of the financial year, after the company’s full results are audited and approved at the Annual General Meeting.
Note: Dividends are paid out of the company’s profits, not from the capital you invested. Also, not all companies pay dividends.
Stock Split
When the company divides its shares into a larger number of shares, which increases the number of outstanding shares and reduces the price per share. For example, if you have 100 shares of a company @ Rs 50 per share and it splits 1:2. You will now have 200 shares @ Rs 25 per share. This is usually done to make the stock more affordable and attractive to small/retail investors.
Note: Not all companies choose to split shares. MRF, for instance, hasn’t split its stock since 1975—resulting in a current price of ₹1,55,000 per share. This deliberately high price acts as a barrier to speculative trading, attracting only experienced, long-term investors, who aren’t affected by short-term market volatility. This strategy maintains price stability and cultivates an exclusivity around the stock.
Bonus Share
When a company issues additional shares to existing shareholders drawn from accumulated reserves or profits. For example, if you own 100 shares of a company and it declares a 1:1 bonus, you’ll receive 100 additional shares—doubling your holding to 200 shares at no cost. This is typically done to reward loyal shareholders, improve liquidity, and signal strong financial health without affecting the company’s overall market capitalization.
Note: Unlike dividends, bonus shares are tax-free when received(only taxed upon sale). Companies with strong reserves often prefer bonus issues over cash dividends to conserve capital for growth while still rewarding shareholders. Indian IT giants like Infosys, TCS, and Wipro have consistently issued bonus shares over decades, significantly multiplying early investors’ holdings.
Effects on dividends
Bonus shares and stock splits multiply the number of shares you own. While individual dividend per share may reduce proportionally, your total dividend income remains the same initially. However, when companies raise dividends in the future, you benefit from a much larger shareholding—turning long term investments into substantial passive income streams over decades.
Retrospection
Now, coming back to the question, how much you would have earned if you had invested ₹4,750 in Infosys at IPO in 1993?
| Date | Event | Ratio | Shares Owned |
|---|---|---|---|
| 1993 | IPO | - | 50 |
| 1994 | Bonus Issue | 1:1 | 100 |
| 1997 | Bonus Issue | 1:1 | 200 |
| 1999 | Bonus Issue | 1:1 | 400 |
| 1999 | Stock Split | 2:1 | 800 |
| 2004 | Bonus Issue | 3:1 | 3,200 |
| 2006 | Bonus Issue | 1:1 | 6,400 |
| 2014 | Bonus Issue | 1:1 | 12,800 |
| 2015 | Bonus Issue | 1:1 | 25,600 |
| 2018 | Bonus Issue | 1:1 | 51,200 |
It would have grown to ₹7.64 Crores - a CAGR of 26% over 32 years. Through 8 bonus issues and 1 stock split, your original 50 shares would have multiplied 1,024 times to 51,200 shares. And in this calculation, we have excluded the dividend payouts. In 2025 alone, you would have earned ₹23 Lakhs as dividends @ ₹45 per share.
We will cover fundamental and tech analysis in the next post. But still want to give a reality check - none of us would have the patience to hold on to the stock for 30 years. If you would study the chart, you would notice that during the dot com bubble burst there was a bad period for the IT industry as a whole. Infosys(along with all the other IT giants) took a major hit. At this time, you(and me) would have exited from the stock and booked heavy losses. Assuming that we can recover our original capital in intraday or even better, by entering into F&O. Knowing the fundamentals of markets can help you understand in what you invest. Holding that stock through thick and thin is the true test of discipline.
When I was in my second year of college, I bought IRFC@21 and RVNL@27 for long term. Within 1 year, I was getting 2x returns on my investment. Looked at “target price” from a few reputed analysts/amc and the inflating RSI. Booked profits with the intention to re-enter after a correction. Guess what? Within 2 years IRFC peaked at 200+ and RVNL at 600+ and I never got the chance to re-enter. Peter Lynch(Fidelity) bought Dunkin’ Donuts because his kids loved it and studied Taco Bell because he noticed long queues. Rakesh Jhunjhunwala() bought Titan @ ₹3 in 2002-2003 when everyone thought wrist watches were dead(mobile phones became accessible to the public). Ramdeo Agrawal(Motilal Oswal) identified PI Industries in early 2000s, studied the agrochemicals space, understood the export opportunity, and even met the management. You will find similar stories across different countries/markets. What connects them all? Investors in all these stories understood what they owned, and had the trust in the vision and/or management of the company during market volatility.
One last question, do you even need to hold a stock(or anything in life) this long? You were 25 in 1993. In 2025, you will be 57! Even with all this money, can you really do what all you could have done in your 20s? The following is an advertisement from Air India from the 80s-90s.
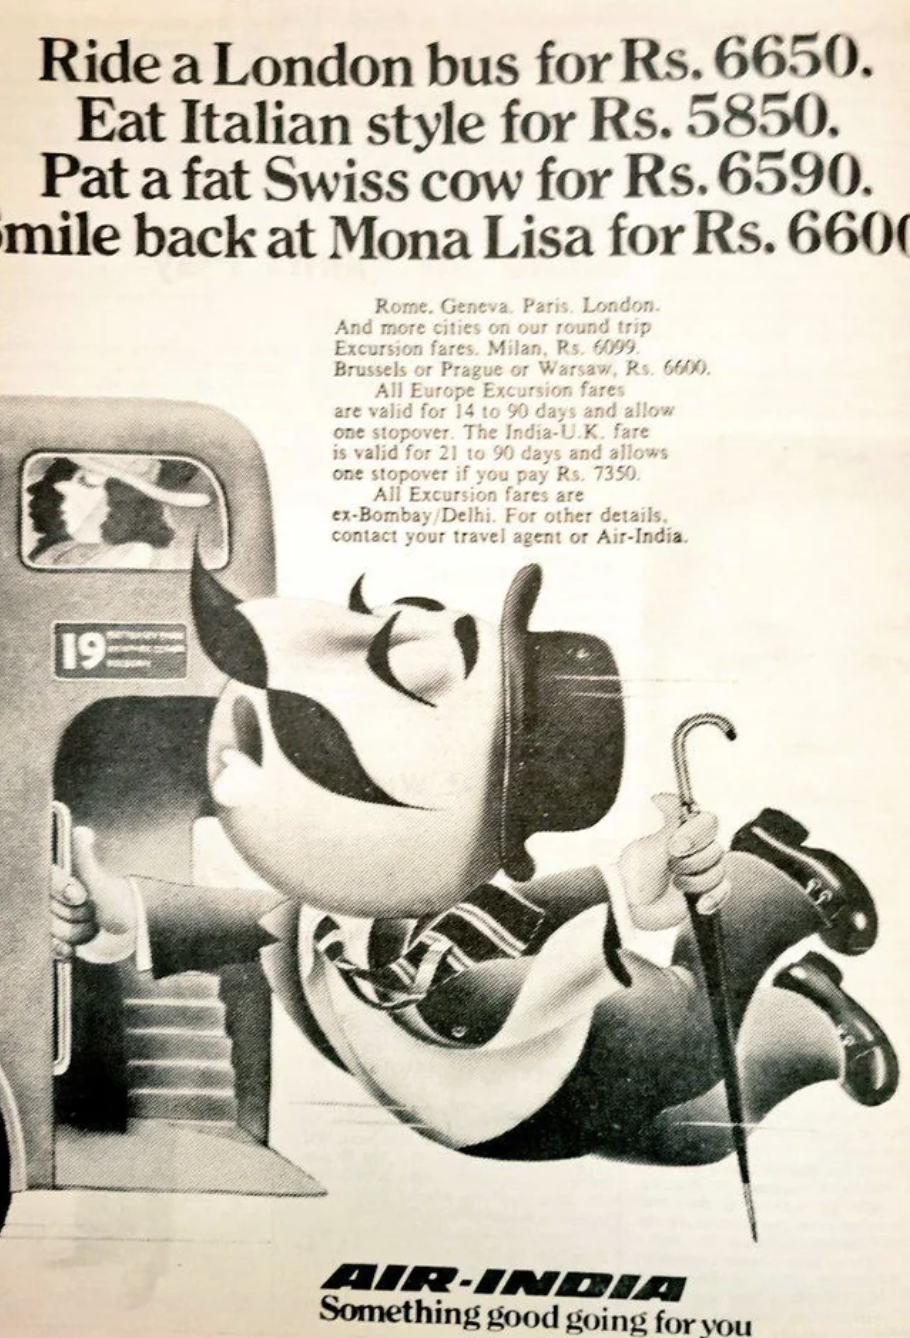
What would have been more valuable to you? A trip to Europe at 25, or a 4BHK in a metro city at 60? The answer is subjective. It depends on what one values more: the memories of an experience, or the pride of owning a valuable asset.
So, before you invest in any asset, you should always predetermine the investing period and the purpose of the investment. Never let the panic or greed take over your decision making process. Now, the two major questions in equity markets are:
- What to buy?
- When to buy?
We will cover the first question in the next post.