The democratization of investing is beautiful—anyone with ₹500 can now own a piece of India’s best companies. But this accessibility is a double-edged sword. The same app that lets you buy blue-chips in seconds also makes it dangerously easy to YOLO your savings into penny stocks at 3 AM. The tools have evolved, but the fundamentals haven’t: know what you own, understand why you own it, and have the patience to let quality compound.
For sure ways to lose money in stock markets
-
Buying stocks at the wrong time.
-
Buy high and sell low.
- Always mix investment with insurance and purchase protection plans like ULIPs, Term Insurance, etc.
Attribution
Before we start, I want to make sure you I am not a SEBI certified analyst or so called ‘expert’ in the stock market from a finance background. I am a software engineer, trying to figure out the stock market, so I don’t have to rely on the mercy of Mutual Fund Houses and other financial institutions. All that I have learned is from my own research(from various sources) and experience(good and bad). Here is a list of resources and tools that I found useful out of all the garbage and scamster.
- Sources:
- Tools:
Table of Contents
- For sure ways to lose money in stock markets
- Attribution
- Basics
- Analysis Framework
- Fundamental Analysis: Understanding Business Value
- Technical Analysis: Timing Your Entries
- Putting It All Together: Holistic Investment Framework
- Advanced Concepts and Nuances
- Continuous Learning Resources
- Final Thoughts: The Investing Mindset
Basics
Market Session Structure
Daily Trading Schedule:
1. Pre-Opening Session (9:00 AM - 9:15 AM)
- 9:00 - 9:07: Order Placement Phase - Place your orders
- 9:08 - 9:11: Order Matching Phase - System matches buy/sell orders
- 9:12 - 9:15: Buffer Period - Final price stabilization
2. Regular Trading Hours (9:15 AM - 3:30 PM)
- Main trading window for retail investors
- All buying and selling happens during this time
3. Post-Market Session (3:30 PM - 4:00 PM)
- Primarily for brokers to settle trades
- Limited retail participation
4. After Market Orders - AMO (4:00 PM - 9:00 AM next day)
- Place orders when markets are closed
- These orders get queued and execute at 9:15 AM next morning
Note: This 15-minute window absorbs overnight news and prevents wild price swings at market open. It’s like a pressure valve that establishes fair opening prices.
Imagine if markets opened directly at 9:00 AM. Overnight, major news breaks:
- Company announces fantastic results at 11 PM
- Or global markets crash while we’re sleeping
- Or RBI announces surprise rate cut on a weekend/holiday
Without pre-opening, big institutional traders (who monitor news 24/7) place orders instantly at 9:00 AM, while regular retail investors (you and me) are still processing the news. This results in stock opening at extreme price (very high or very low), and by the time you react, the opportunity is gone and you end up buying/selling at unfair prices.
How Pre-Opening saves retail investors
Phase 1: Order Collection (9:00-9:07 AM) Everyone places orders - institutions, retail traders, everyone. No trades execute yet, just orders collected. You have 7 minutes to process overnight news and place your order.
Phase 2: Order Matching (9:08-9:11 AM) System runs an algorithm to find equilibrium price. Calculates: “At what price can maximum shares be traded?” All buy and sell orders are matched at this SINGLE price.
Phase 3: Buffer Period (9:12-9:15 AM) Opening price is displayed but frozen. No new orders can be placed/modified. Everyone can see where market will open.
Outcome: Level playing field - your 9:02 AM order has same priority as institutional order. No one gets advantage, everyone gets same opening price.
Note: Pre-opening is like a “democracy vote” for opening price instead of a “fastest finger first” game. It protects small investors from being at a disadvantage against institutional players with faster systems and 24/7 news monitoring.
Trading Days & Holidays
Markets are OPEN:
- Monday to Friday (9:15 AM - 3:30 PM)
- Special Session - Muhurat Trading: Diwali evening (1 hour, around 6-7 PM).
- Orders placed on weekends/holidays queue as AMO and execute next working day at 9:15 AM.
Markets are CLOSED:
- Weekends (Saturday & Sunday)
- National holidays and major festivals (Republic Day, Independence Day, Holi, Diwali, Christmas, etc.)
Settlement Cycle
Indian equity markets operate on a T+1 settlement cycle, where trades execute immediately but settlement occurs one working day later.
Settlement Examples:
- The “T” stands for Trade date, “+1” means add 1 working day
- Trade on Monday → Settlement on Tuesday
- Trade on Friday → Settlement on Monday (skips weekend)
Note: India moved from T+2 to T+1 settlement(and T+0 for select stocks) in January 2023, making it one of the fastest settlement cycles globally. Read more.
Types of Markets
| Feature | Primary Market | Secondary Market |
|---|---|---|
| Purpose | To raise fresh capital | To trade existing securities |
| Type of Offering | IPO (first-time) or FPO (additional capital) | Already-listed shares |
| Transaction Between | Company ↔ Investor | Investor ↔ Investor |
| Price Discovery | Book-building process | Market forces (demand & supply) |
Example:
- Primary Market: Zomato IPO (2021) - Company raised ₹9,375 Cr directly from investors
- Secondary Market: You buying Zomato shares today on NSE - Money goes to the seller (and not Zomato)
Types of Orders
| Order Type | What It Is | Execution | Example | When to Use | Risk/Note |
|---|---|---|---|---|---|
| Market Order | Executes immediately at current market price | Instant execution, price may vary | Reliance at ₹2,500 → Order executes at ₹2,499-₹2,501 | Need to enter/exit quickly, can’t miss opportunity | Slippage - actual price may differ from screen price in volatile markets |
| Limit Order | You set maximum buy price or minimum sell price | Executes ONLY at your price or better | TCS at ₹3,500, you place limit at ₹3,450 → Executes only if TCS drops to ₹3,450 or below | Patient, want specific price point, not urgent | May never execute if price doesn’t reach your limit |
| Stop Loss Market | Safety net - auto sells if price falls to trigger | Triggers at set price, sells at current market price | Buy at ₹1,600, trigger at ₹1,520 → Hits ₹1,520 → Sells immediately at market | Protect from bigger losses, guaranteed exit | Execution guaranteed but final price uncertain (could be ₹1,520 or ₹1,515) |
| Stop Loss Limit | Safety net with price range control | Triggers at set price, sells only within your price range | Trigger ₹95, Limit ₹93 → Hits ₹95 → Sells only between ₹95-₹93 | Want loss protection + price control | If price crashes past your limit instantly (₹95→₹92), order won’t execute |
| IOC (Immediate or Cancel) | Execute now or cancel completely | Executes immediately whatever is available, cancels rest | Want to buy 1,000 shares, only 300 available → Gets 300, cancels 700 | Don’t want partial fills sitting in order book | All-or-nothing execution at current moment |
| GTC (Good Till Cancelled) | Order stays active until filled or manually cancelled | Remains in system for days/weeks | Place limit order on Monday → Stays active till Friday or until you cancel | Long-term price targets, patient investing | Remember to cancel manually or it stays indefinitely |
| Disclosed Quantity | Large order showing only small portion to market | Shows small quantity, auto-refills as it executes | Want 10,000 shares but show only 500 at a time | Large orders without moving market price | Prevents tipping off other traders about your big position |
Price Movements
Gap Opening
Markets rarely open exactly where they closed. After-market orders accumulate overnight, creating supply-demand imbalances.
Gap Up Opening - Opening price exceeds previous close, indicating positive overnight sentiment.
Gap Down Opening - Opening price falls below previous close, signaling negative overnight news.
Circuit Breakers
Price band limits preventing extreme single-day volatility, typically set at 5%, 10%, or 20% bands.
Common Circuit Limits:
- 5% circuit - Large-cap stocks
- 10% circuit - Mid-cap stocks
- 20% circuit - Small-cap and volatile stocks
Market-Wide Circuit Breakers (Index Level)
Beyond individual stocks, NSE and BSE have market-wide circuit breakers that halt ALL trading when indices fall/rise sharply:
Index Circuit Breaker Levels:
| Change ffrom Previous Close | Action | Trading Halt Duration |
|---|---|---|
| 10% change | 🟡 Level 1 Circuit | 45 minutes |
| 15% change | 🟠 Level 2 Circuit | 1 hour 45 minutes |
| 20% change | 🔴 Level 3 Circuit | Rest of the day |
Time-Based Rules:
- If 10% circuit hit before 1:00 PM → 45-minute halt
- If 10% circuit hit after 2:30 PM → No halt
Instances when market circuit breakers were hit
2009 Lok Sabha Election Results
- Impact: SENSEX locked at 14,272.62(+17.24%), NIFTY locked at 4,308.05(+17.33%).
- Reason: UPA II returned to power with better majority, no longer dependent on the Left.
COVID-19 Crash (March 2020)
- Impact: SENSEX crashed 13.15%, NIFTY down 12.98%. Level 2 (15%) circuit breaker triggered
- Reason: Global pandemic panic, nationwide lockdown announced
Harshad Mehta Scam (1992)
- Impact: SENSEX plunged 12.77%
- Reason: Securities scam exposure, massive manipulation uncovered
Global Financial Crisis (2008)
- Impact: 10%+ crashes on multiple days
- Reason: Lehman Brothers collapse, sub-prime mortgage crisis
Note: Circuit breakers protect the entire market from panic selling or euphoria. They give investors time to think rationally rather than selling/buying in fear. Sharp rallies are often followed by profit-booking by big players at the expense of retail investors.
Face Value vs Market Value
Face Value - Nominal value printed on share certificate, used for dividend calculations and corporate actions.
Market Value - Current trading price determined by supply-demand dynamics.
Example: MRF face value = ₹10, market value = ₹1,55,000+
Corporate Actions
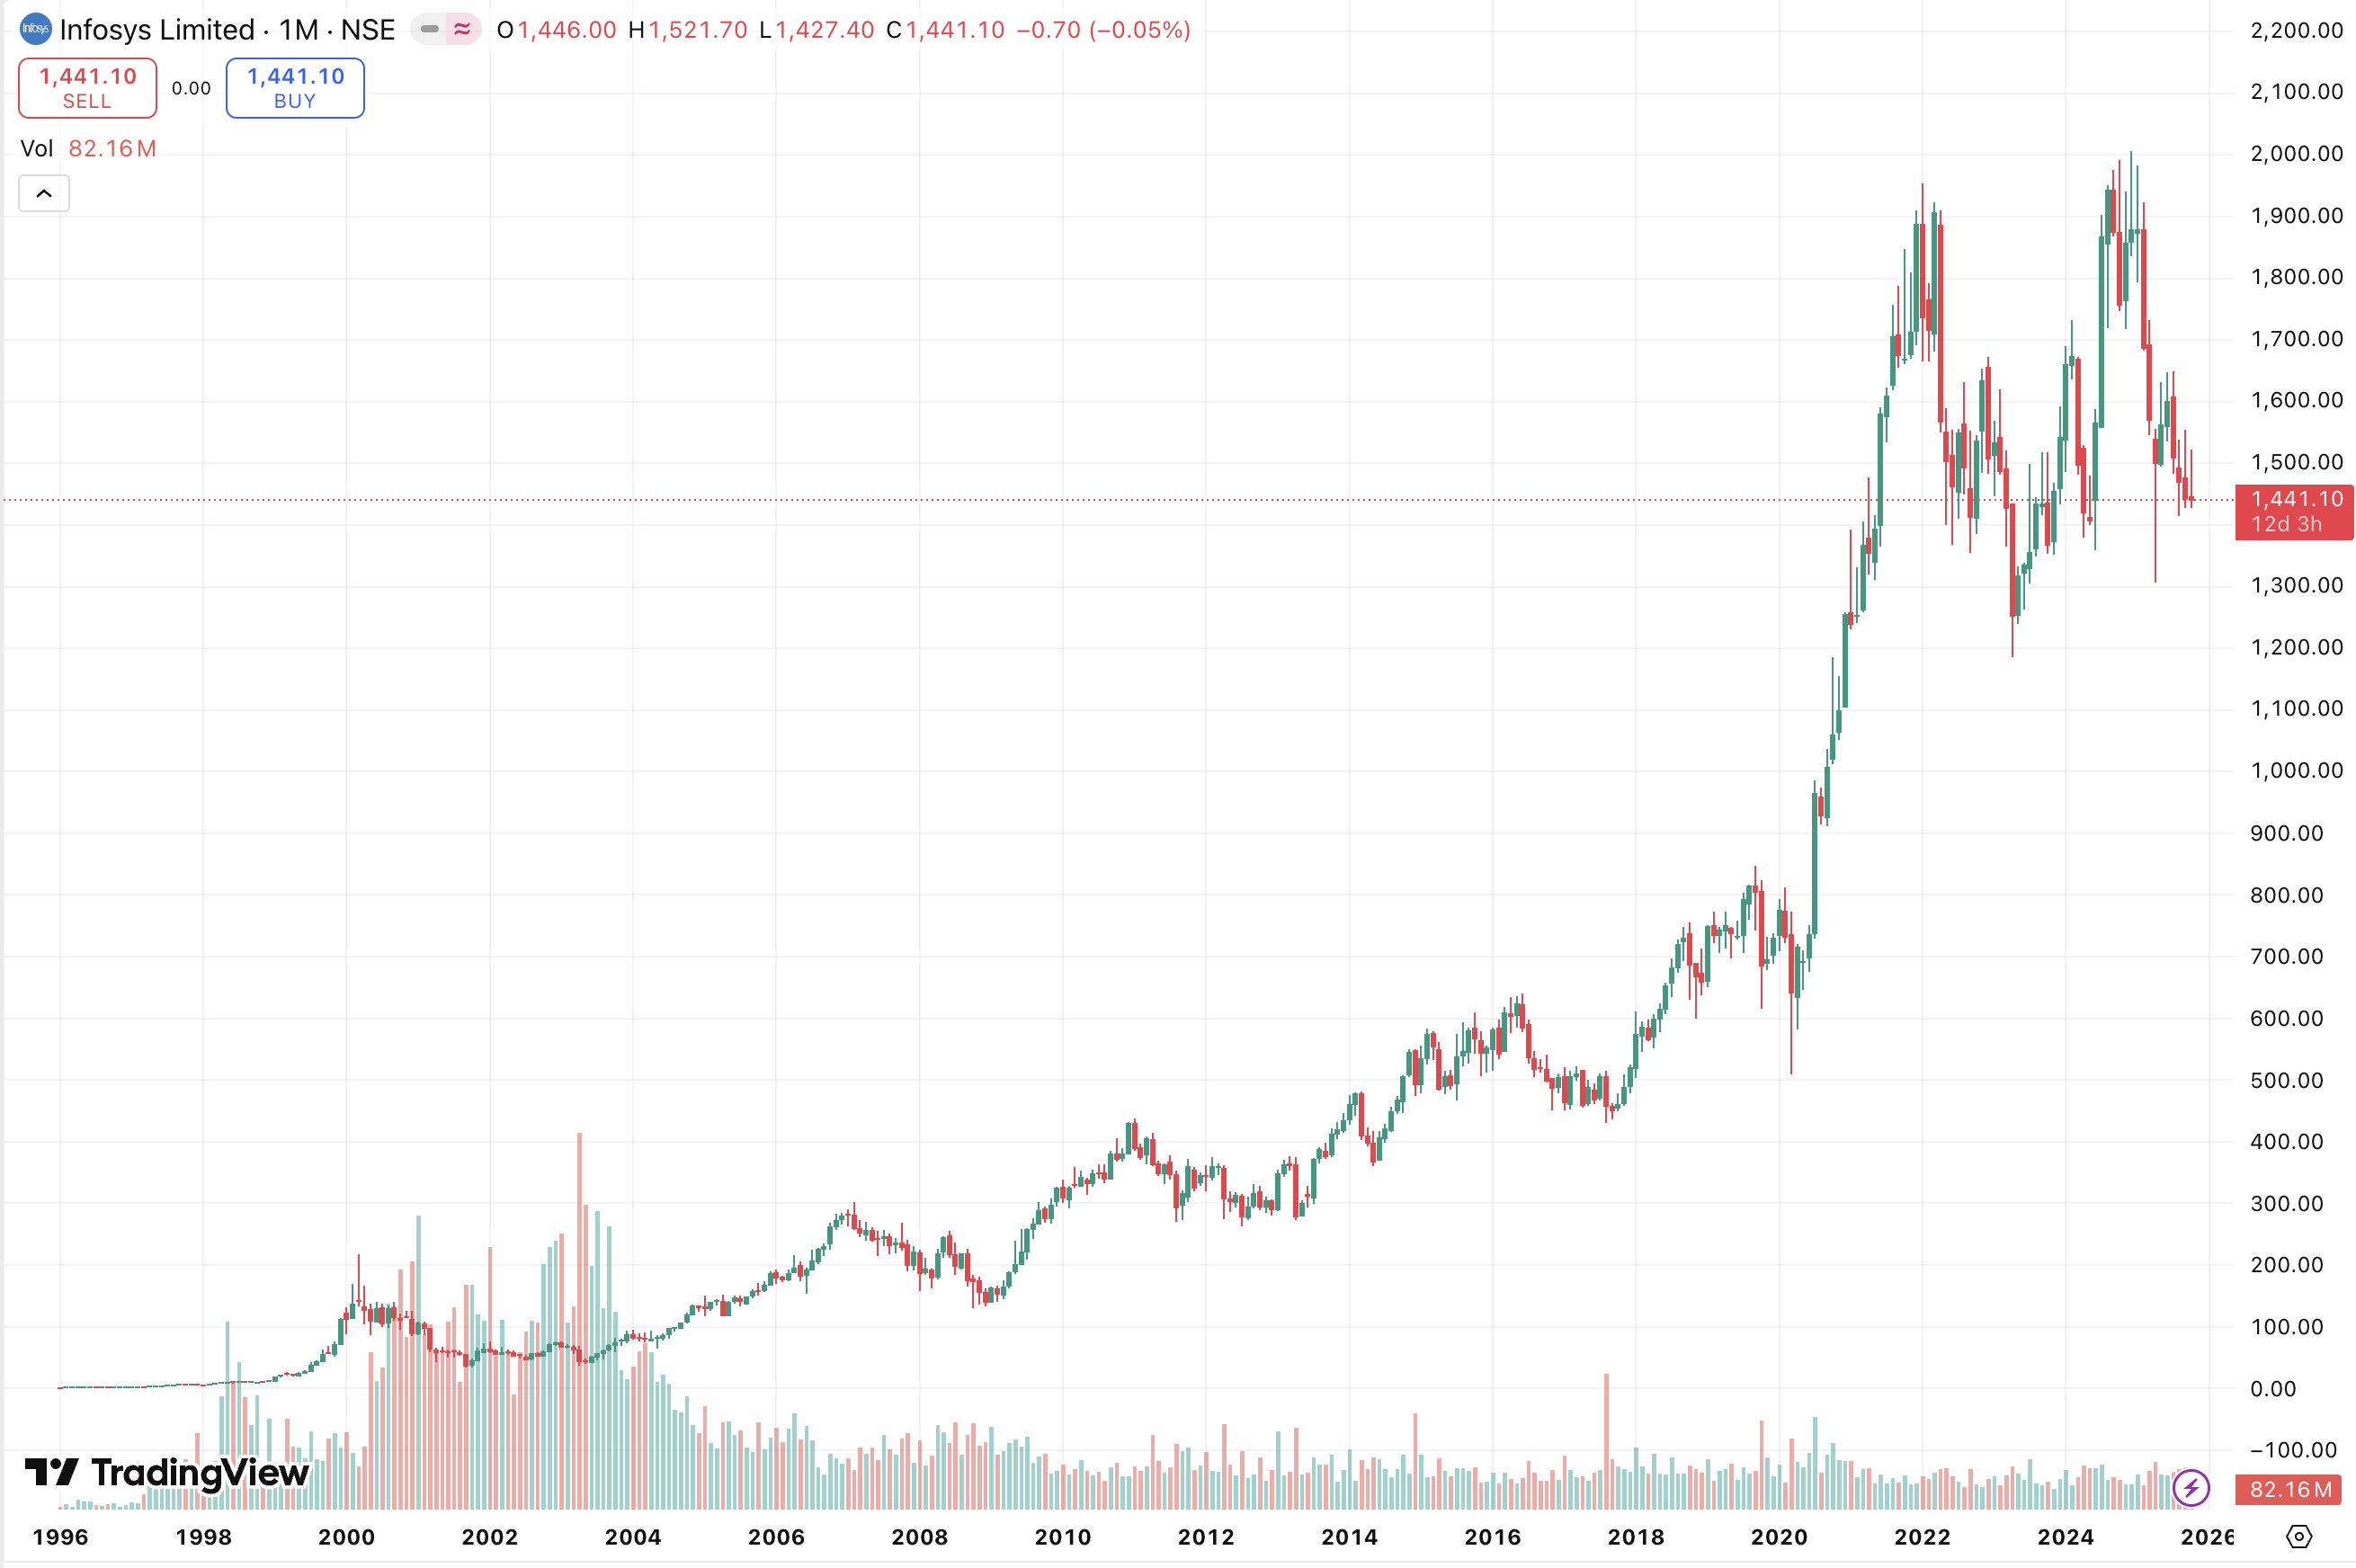
The chart above shows Infosys stock price growing from ₹95 to ₹1,500 over 30 years—a 15x return on paper. However, this only reflects price appreciation and ignores the massive impact of corporate actions like stock splits and bonus issues that multiplied shareholders’ actual holdings.
Dividends
It is the distribution of profits to shareholders based on face value (not market value). You can assume this as ‘interest’ earned on your long term investment.
Important Dates:
- Announcement Date: Corporate action declared
- Record Date: Shareholders on this date receive benefits
- Ex-Date: Trades after this date don’t qualify for announced benefits
Stock Split
When the company divides its shares into a larger number of shares, which increases the number of outstanding shares and reduces the price per share. For example, if you have 100 shares of a company @ Rs 50 per share and it splits 1:2. You will now have 200 shares @ Rs 25 per share. This is usually done to make the stock more affordable and attractive to small/retail investors.
Note: Not all companies choose to split shares. MRF, for instance, hasn’t split its stock since 1975—resulting in a current price of ₹1,55,000 per share. This deliberately high price acts as a barrier to speculative trading, attracting only experienced, long-term investors, who aren’t affected by short-term market volatility. This strategy maintains price stability and cultivates an exclusivity around the stock.
Bonus Share
When a company issues additional shares to existing shareholders drawn from accumulated reserves or profits. For example, if you own 100 shares of a company and it declares a 1:1 bonus, you’ll receive 100 additional shares—doubling your holding to 200 shares at no cost. This is typically done to reward loyal shareholders, improve liquidity, and signal strong financial health without affecting the company’s overall market capitalization.
Note: Unlike dividends, bonus shares are tax-free when received(only taxed upon sale). Companies with strong reserves often prefer bonus issues over cash dividends. Indian IT giants like Infosys, TCS, and Wipro have consistently issued bonus shares over decades, significantly multiplying early investors’ holdings.
Effects on dividends
Bonus shares and stock splits multiply the number of shares you own. While individual dividend per share may reduce proportionally, your total dividend income remains the same initially. However, when companies raise dividends in the future, you benefit from a much larger shareholding—turning long term investments into substantial passive income streams over decades.
Now, coming back to the question, how much you would have earned if you had invested ₹4,750 in Infosys at IPO in 1993?
| Date | Event | Ratio | Shares Owned |
|---|---|---|---|
| 1993 | IPO - ₹95/share | - | 50 |
| 1994 | Bonus Issue | 1:1 | 100 |
| 1997 | Bonus Issue | 1:1 | 200 |
| 1999 | Bonus Issue | 1:1 | 400 |
| 1999 | Stock Split | 2:1 | 800 |
| 2004 | Bonus Issue | 3:1 | 3,200 |
| 2006 | Bonus Issue | 1:1 | 6,400 |
| 2014 | Bonus Issue | 1:1 | 12,800 |
| 2015 | Bonus Issue | 1:1 | 25,600 |
| 2018 | Bonus Issue | 1:1 | 51,200 |
It would have grown to ₹7.64 Crores - a CAGR of 26% over 32 years. Through 8 bonus issues and 1 stock split, your original 50 shares would have multiplied 1,024 times to 51,200 shares. Beyond capital appreciation, these shares would generate ₹23 Lakhs annually in dividends alone at 2025’s dividend rate of ₹45 per share.
We will cover this in more detail in the next section. But still want to give a reality check - none of us would have the patience to hold on to the stock for 30 years. During the dot-com bubble burst (2000-2002), Infosys crashed to ₹10 along with every other IT stock. Your ₹4,750 investment would’ve been worth barely ₹500. At that moment, watching 90% of your capital evaporate, most of us (myself included) would’ve panicked and exited—booking heavy losses. And then, in classic retail investor fashion, tried to “recover” our capital through intraday trading or F&O, likely losing even more. The 1,024x return looks beautiful in hindsight, but living through those drawdowns? That’s the real test legends pass and most of us fail.
Peter Lynch managed billions for Fidelity with a simple philosophy: invest in what you know. He bought Dunkin’ Donuts because his kids loved it, studied Taco Bell because he noticed long queues. Rakesh Jhunjhunwala (Big Bull of India) bought Titan at ₹3 in 2002-2003 when everyone thought watches were dead (mobile phones showed time). He saw Indians’ love for jewelry and believed in Tanishq’s potential. Held through multiple corrections. Ramdeo Agrawal (Motilal Oswal) identified PI Industries in early 2000s when it was a ₹20 stock. Studied the agrochemicals space, understood the export opportunity, and watched management execution year after year.
Investor Categories
| Category | Full Form | Threshold/Definition | Examples |
|---|---|---|---|
| RII | Retail Individual Investors | Investment < ₹2 lakhs in IPOs | You, me, salaried professionals, small traders |
| HNI | High Net Worth Individuals | Investment > ₹2 lakhs in IPOs | Business owners, wealthy individuals, family offices |
| DII | Domestic Institutional Investors | Indian institutions managing pooled money | SBI Mutual Fund, LIC, HDFC AMC, ICICI Prudential, UTI |
| FII/FPI | Foreign Institutional/Portfolio Investors | International investors bringing foreign capital | Government of Singapore, Europacific Growth Fund |
Market Capitalization Segments
Market Cap Formula:
Market Capitalization = Total Outstanding Shares × Current Market Price
Classification:
- Large Caps: Market cap > ₹10,000 crores (Blue-chip companies)
- Mid Caps: Market cap between ₹500 - ₹10,000 crores
- Small Caps: Market cap < ₹500 crores
Market Indices
NIFTY (NSE) - Top 50 companies across sectors (National Fifty)
SENSEX (BSE) - Top 30 companies (Sensitivity Index)
SX40 (MSE) - Top 40 companies (Securities Exchange 40)
Free Float Market Cap calculation excludes promoter holdings:
Understanding Free Float Market Cap:
| Component | Value | Explanation |
|---|---|---|
| Total Shares | 1,00,00,000 | All shares issued by company |
| Promoter Holding | 60% | Locked with founders/promoters |
| Public Holding | 40% | Available for trading |
| Freely Floating Shares | 40,00,000 | Only these count |
| Market Price | ₹500 | Current trading price |
| Free Float Market Cap | ₹200 Crores | 40,00,000 × ₹500 |
Why it matters:
- Index calculations use free float, not total market cap
- More accurate representation of tradable value
- Promoter shares aren’t available for buying/selling
- Higher free float = Better liquidity
Short Selling Mechanics
Short selling enables profit from falling prices by selling borrowed shares.
How Short Selling Works:
The Process:
- Morning 9:30 AM - You think HDFC Bank (currently ₹1,600) will fall today
- You sell first - Sell 1000 shares at ₹1,600 (you don’t own them yet!)
- Market falls - Price drops to ₹1,550 by afternoon
- You buy back - Buy 1000 shares at ₹1,550
- You profit - Sell high (₹1,600), buy low (₹1,550) = ₹50 profit per share(₹50,000 total profit)
Critical Rules:
- Must square off same day - Buy back before 3:30 PM
- If you forget - Shares go to auction market (3:30-4:00 PM)
- Auction consequences:
- Any loss = You pay
- Any profit = Goes to IEPF, not you!
When to short sell:
- You’re bearish (expect market/stock to fall)
- Only for intraday trading
- Good for volatile falling markets
Warning: Short selling is risky - losses can be unlimited if stock rises sharply. Don’t try it unless you’re sure about what you’re doing.
Tax Implications
| Type | Holding Period | Tax Rate |
|---|---|---|
| LTCG | > 1 year | 12.5% |
| STCG | ≤ 1 year | 20% |
| Dividend | Any | Added to income, taxed at slab rate |
Analysis Framework
Fundamental Analysis answers: “WHAT to buy?”
What it is: Studying the business, its financials, management, and industry to determine if the company is worth owning.
What it uses:
- Annual reports and financial statements
- Balance sheet, P&L, cash flow analysis
- Financial ratios (Current Ratio, Debt/Equity, ROCE, P/E, P/B, EPS, etc.)
- Management quality assessment
- Industry and economy trends
What it determines:
- Intrinsic value - The true worth of the business
- Is the company profitable and growing?
- Is management honest and capable?
- Does the business have competitive advantages?
When to use:
- Screening stocks - Finding quality companies worth investing in
- Finding undervalued gems - Identifying stocks trading below their true value
- Long-term investing - Building a portfolio for years
- Wealth creation - Compounding returns over time
Technical Analysis answers: “WHEN to buy?”
What it is: Studying price charts, patterns, and trading volume to identify the right time to enter or exit positions.
What it uses:
- Price charts (candlesticks, patterns, trends)
- Technical indicators (SMA, EMA, MACD, RSI)
- Volume analysis
- Support and resistance levels
What it determines:
- Market sentiment - Are buyers or sellers in control right now?
- Is the stock in uptrend, downtrend, or sideways?
- Where are the key support/resistance levels?
- What’s the optimal entry and exit price?
When to use:
- Timing your entry/exit - Getting the best price for buying/selling
- Riding momentum - Catching stocks in strong trends
- Risk management - Setting precise stop loss levels
- Short-term trading - Intraday or swing trading strategies
The Power of Technical Analysis:
Advantage #1: Works on ANY Stock
- Don’t need to understand the business deeply
- Can trade sectors you’re not expert in
- Even works on stocks with no fundamentals (penny stocks, momentum plays)
Advantage #2: Faster Decisions
- Fundamental analysis takes hours/days (reading annual reports, calculating ratios)
- Technical analysis takes minutes (check chart, indicators, volume)
- Perfect for part-time investors with day jobs
Advantage #3: Clear Entry/Exit Rules
- Fundamentals say “TCS is a good company” but don’t tell you when to buy
- Technicals say “Buy TCS at ₹3,450 support, sell at ₹3,650 resistance” - Specific!
Advantage #4: Risk Management
- Fundamentals can’t tell you where to place stop loss
- Technicals give you exact levels based on support zones
Advantage #5: Works in Bear Markets Too
- Fundamental investors struggle when everything falls
- Technical traders can short sell and profit from falling prices
The BEST Approach: Combine Both!
| Step | Use | Reason |
|---|---|---|
| Step 1 | Fundamental Analysis | Find 10-15 quality stocks worth owning |
| Step 2 | Technical Analysis | From those 10-15, pick ones showing bullish chart patterns |
| Step 3 | Buy with technical entry | Get best price using support levels |
| Step 4 | Hold with fundamental confidence | Don’t panic on small dips, business is strong |
Real Example:
Asian Paints Analysis:
- ✅ Fundamental Check: ROCE 35%, debt-free, consistent profit growth → Quality stock
- ⚠️ Current Price: ₹3,200
- 📉 Technical Check: Stock in downtrend, 5 EMA below 13 EMA, breaking support
- Decision: Good company, WRONG time. Wait for uptrend reversal.
- Action: Add to watchlist, buy when chart turns bullish (maybe at ₹2,900 support)
The Mistake Most Investors Make:
- Buying fundamentally strong stocks at technically wrong levels
- Result: Stuck in losses for months even though company is great
- Solution: Use fundamentals to pick stocks, technicals to time entries
Fundamental Analysis: Understanding Business Value
1. Quantitative Analysis (Number-driven)
- Economy Analysis - Is the overall economy growing?
- Industry Analysis - Is the sector doing well?
- Company Analysis - Are the company’s numbers strong?
2. Qualitative Analysis (Quality-driven)
- Management Analysis - Is the leadership honest and capable?
Financial Statements Deep Dive
Annual reports contain comprehensive business information through standardized financial statements:
1. Balance Sheet Structure
The Balance Sheet Equation: Assets = Liabilities + Equity
Left Side - What the Company OWNS (Assets):
Non-Current Assets (Long-term, can’t convert to cash quickly)
- Fixed Assets: Land, buildings, machinery
- Intangible Assets: Patents, trademarks, goodwill
- Long-term Investments: Shares in other companies
Current Assets (Short-term, can convert to cash within a year)
- Inventories: Goods ready to sell
- Trade Receivables: Money customers owe you
- Cash & Cash Equivalents: Bank balance
- Short-term Investments: FDs, liquid funds
Right Side - What the Company OWES + OWNS (Liabilities + Equity):
Shareholder’s Funds (Owner’s money)
- Share Capital: Initial investment by shareholders
- Reserves & Surplus: Accumulated retained profits
Non-Current Liabilities (Long-term debt, payable after 1 year)
- Long-term loans, debentures, bonds
Current Liabilities (Short-term debt, payable within 1 year)
- Trade Payables: Money you owe suppliers
- Short-term loans and dues
Key Balance Sheet Terms:
Shareholder’s Funds (Equity) - Owners’ capital investment forming the foundation.
Reserves & Surplus - Retained profits reinvested rather than distributed, including:
- General Reserves
- Retained Earnings
- Securities Premium
Non-Current Liabilities - Debt payable beyond one year (debentures, long-term loans).
Critical Warning: If loan funds significantly exceed equity, extreme caution required. Historical disasters: Jet Airways, Suzlon, Reliance Communications.
2. Profit & Loss Statement
The P&L Waterfall (Example with ₹100 Crores revenue):
| Step | Description | Amount (₹ Cr) |
|---|---|---|
| Sales/Revenue | Total money earned | 100 |
| Less: Operating Costs | Raw materials, salaries, rent | -60 |
| = EBITDA | Operating profit before interest, tax, depreciation | 40 |
| Less: Depreciation & Amortization | Asset value reduction | -10 |
| = EBIT | Earnings before interest and tax | 30 |
| Less: Interest Expense | Loan interest payments | -10 |
| = PBT | Profit before tax | 20 |
| Less: Tax (30%) | Government’s share | -6 |
| = PAT (Net Profit) | Final profit shareholders get | 14 |
Key Terms Explained:
- EBITDA - Core business profitability (most important for operations)
- EBIT - Operating profit after accounting for asset depreciation
- PBT - Profit before paying taxes
- PAT - The bottom line - actual profit available to shareholders
3. Cash Flow Statement Components
Operating Activities - Cash from core business operations
- Negative = Core business burning cash (danger signal)
- Positive = Healthy operational cash generation
Investing Activities - Capital expenditure and asset sales
- Negative = More investments than divestments (often positive signal)
- Positive = Asset liquidation (context-dependent)
Financing Activities - Debt, equity, and dividend transactions
- Negative = Debt repayment or dividend distribution
- Positive = Fresh borrowing or equity raising
Important Financial Ratios
1. Current Ratio - Liquidity Assessment
Formula: Current Ratio = Current Assets ÷ Current Liabilities
What it measures: Can the company pay its short-term bills?
Example Calculation:
| Item | Amount (₹ Cr) |
|---|---|
| Current Assets (cash, inventory, receivables) | 200 |
| Current Liabilities (short-term dues) | 100 |
| Current Ratio | 2.0 |
Interpretation Guide:
| Ratio | Status | Meaning |
|---|---|---|
| ≥ 2.0 | ✅ Excellent | ₹2 of assets for every ₹1 liability - Very healthy |
| 1.0-2.0 | ⚠️ Adequate | Can pay bills but monitor closely |
| < 1.0 | ❌ Danger | Not enough assets to pay liabilities - Red flag! |
Real-world example:
- Company has ₹200 Cr in current assets
- Owes ₹100 Cr in short-term liabilities
- Current Ratio = 200/100 = 2.0 ✅
- Interpretation: Company can comfortably pay all short-term dues
Why 2:1 is ideal: Provides safety buffer. Even if assets lose 50% value, company can still pay all bills.
2. Debt to Equity Ratio - Leverage Analysis
Formula: Debt to Equity = Long-term Debt ÷ (Share Capital + Reserves)
What it measures: How much the company relies on borrowed money vs owner’s money
Example Calculation:
| Component | Amount (₹ Cr) |
|---|---|
| Long-term Debt | 150 |
| Share Capital | 100 |
| Reserves & Surplus | 400 |
| Total Equity | 500 |
| Debt to Equity Ratio | 0.30 (or 0.3:1) |
Interpretation Guide:
| Ratio | Status | Meaning |
|---|---|---|
| 0 | ⭐ Best | Completely debt-free - No financial stress |
| < 1 | ✅ Good | Conservative - More equity than debt |
| 1-2 | ⚠️ Caution | Moderate leverage - Monitor carefully |
| > 2 | ❌ Danger | High risk - Debt is 2x the equity! |
Why it matters:
- High debt = High interest payments
- Economic slowdown → Can’t pay loans → Bankruptcy risk
- Remember: Jet Airways, Suzlon had debt/equity > 3!
Sector exceptions: Banks and NBFCs naturally have high debt (it’s their business model), so ignore this ratio for financial companies.
3. Return on Capital Employed (ROCE)
Formula: ROCE = (EBIT ÷ Capital Employed) × 100
Capital Employed = Share Capital + Reserves + Long-term Debt
What it measures: How efficiently is the company using its capital to generate profits?
Example Calculation:
| Component | Amount (₹ Cr) |
|---|---|
| EBIT (Operating Profit) | 300 |
| Share Capital | 200 |
| Reserves & Surplus | 800 |
| Long-term Debt | 500 |
| Capital Employed | 1,500 |
| ROCE | 20% |
Interpretation Guide:
| ROCE | Rating | Meaning |
|---|---|---|
| ≥ 20% | ⭐ Excellent | Every ₹100 invested generates ₹20+ profit |
| 15-20% | ✅ Good | Strong performance, competitive advantage |
| 10-15% | ⚠️ Average | Okay but nothing special |
| < 10% | ❌ Poor | Inefficient capital use - Look elsewhere |
Why it matters:
- Compares profit generation across different capital structures
- Higher ROCE = Better management efficiency
- Always compare with industry average and competitors
- Asian Paints has ROCE ~35%, cement companies ~15-18%
4. Free Cash Flow - Cash Generation Power
Formula: Free Cash Flow = Operating Cash Flow - Net Capital Expenditure
What it measures: Real cash left after running and maintaining the business
Example Calculation:
| Component | Amount (₹ Cr) |
|---|---|
| Operating Cash Flow | 500 |
| Capital Expenditure (purchases) | 350 |
| Sale of Assets | 50 |
| Net CapEx | 300 |
| Free Cash Flow | 200 ✅ |
Multi-Year Trend Analysis:
| Year | FCF (₹ Cr) | Status |
|---|---|---|
| 2020 | -100 | Negative |
| 2021 | -50 | Negative |
| 2022 | -80 | Negative ❌ |
| 2023 | 20 | Positive |
| 2024 | 150 | Positive |
Interpretation:
- 3+ consecutive negative years = ❌ DANGER - Business burning cash
- 1-2 negative years = ⚠️ CAUTION - Monitor closely
- Consistently positive = ✅ Healthy cash generation
Why FCF matters:
- Profit can be manipulated, but cash flow doesn’t lie
- Negative FCF = Company needs external funding to survive
- Positive FCF = Can pay dividends, reduce debt, or expand
- Growth companies may have negative FCF temporarily (expansion phase)
5. Inventory Turnover Ratio
Formula: Inventory Turnover = Cost of Goods Sold ÷ Average Inventory
What it measures: How many times inventory is sold and replaced in a year
Example Calculation:
| Component | Amount (₹ Cr) |
|---|---|
| Cost of Goods Sold (Annual) | 800 |
| Average Inventory | 100 |
| Inventory Turnover | 8 times/year |
| Days to Sell Inventory | 45 days |
What it means: The company sells and replaces its entire inventory 8 times in a year, or every 45 days.
Sector Benchmarks:
| Industry | Typical Turnover | Why? |
|---|---|---|
| FMCG | 12-20 times | Fast-moving, perishable goods |
| Retail | 8-12 times | Regular stock rotation |
| Automobile | 6-10 times | Moderate turnover |
| Heavy Equipment | 2-4 times | Slow-moving, expensive items |
Interpretation:
- Higher turnover = Goods sell quickly, less capital stuck
- Lower turnover = Inventory piling up, potential obsolescence risk
- Compare ONLY within same sector
- Increasing trend over years = ✅ Good
- Declining trend = ⚠️ Demand issues or poor management
6. Reserves & Surplus Growth
What it measures: Is the company consistently retaining and growing profits year-over-year?
Formula: Track absolute reserves value over 5+ years
5-Year Trend Example:
| Year | Reserves (₹ Cr) | Year-on-Year Growth |
|---|---|---|
| 2020 | 1,000 | - |
| 2021 | 1,180 | +18% |
| 2022 | 1,350 | +14.4% |
| 2023 | 1,550 | +14.8% |
| 2024 | 1,780 | +14.8% |
| Average Growth | 15.5% ✅ |
Interpretation Guide:
| Average Growth | Status | Meaning |
|---|---|---|
| > 15% | ⭐ Excellent | Strong profit retention and reinvestment |
| 5-15% | ✅ Good | Steady growth, healthy business |
| 0-5% | ⚠️ Moderate | Slow growth, investigate why |
| Negative | ❌ Concern | Losses or excessive dividends |
Why it matters:
- Growing reserves = Company keeping profits for expansion
- Declining reserves = Warning sign - losses or cash distribution
- Consistent growth over 5+ years = Quality compounding business
- Compare trend, not absolute value
Red flag: If reserves decline while profit is positive, where’s the money going?
7. Price to Earnings (P/E) Ratio
Formula: P/E Ratio = Market Price per Share ÷ Earnings Per Share (EPS)
What it measures: How much you’re paying for each rupee of company earnings
Example Calculation:
| Component | Value |
|---|---|
| Market Price per Share | ₹1,500 |
| Earnings Per Share (EPS) | ₹100 |
| P/E Ratio | 15 |
What it means: You’re paying ₹15 for every ₹1 of annual earnings
Comparative Analysis (Example: IT Sector):
| Company | P/E | Industry Avg | Verdict |
|---|---|---|---|
| Company A | 15 | 22 | Cheaper than industry |
| Company B | 28 | 22 | Expensive vs industry |
| Company C | 12 | 22 | Very cheap - WHY? |
CRITICAL: Always Compare with Industry, Not Absolute Numbers
Interpretation Framework:
Scenario 1: Low P/E + Strong Fundamentals (all 7 ratios good)
- Verdict: ✅ OPPORTUNITY - Undervalued gem
Scenario 2: Low P/E + Weak Fundamentals (poor ratios)
- Verdict: ❌ VALUE TRAP - Cheap for a reason
Scenario 3: High P/E + Strong Fundamentals
- Verdict: ⚠️ Fairly valued or expensive - Market expects growth
Why P/E is the LAST ratio to check:
- First verify business quality (ratios 1-6)
- Then check if price is reasonable (P/E)
- Low P/E alone means NOTHING without context
8. Earnings Per Share (EPS)
Formula: EPS = Profit After Tax (PAT) ÷ Total Outstanding Shares
What it measures: Company’s profit allocated to each share
Example Calculation:
| Component | Value |
|---|---|
| Profit After Tax (PAT) | ₹1,400 Cr |
| Total Outstanding Shares | 140 Cr shares |
| EPS | ₹10 per share |
5-Year EPS Growth Tracking:
| Year | EPS (₹) | Growth % |
|---|---|---|
| 2020 | 50 | - |
| 2021 | 58 | +16% |
| 2022 | 65 | +12% |
| 2023 | 75 | +15% |
| 2024 | 87 | +16% |
| CAGR | 14.8% ✅ |
Interpretation Guide:
| EPS Trend | Status | Meaning |
|---|---|---|
| Consistently growing | ⭐ Excellent | Quality business, increasing profits |
| Stable/flat | ⚠️ Moderate | No growth, mature business |
| Declining | ❌ Red Flag | Falling profitability |
| Volatile | ⚠️ Caution | Inconsistent, risky business |
Why EPS matters:
- Direct indicator of per-share profitability
- Growing EPS → Stock price usually follows up
- Declining EPS → Even if cheap, avoid!
- Check 5-year trend, not just one year
Watch out for: EPS can increase artificially through share buybacks (reducing denominator). Check if PAT is also growing!
Stock Valuation: EV/EBITDA Method
Enterprise Value to EBITDA is a popular valuation method used to calculate fair value of stocks.
Step-by-Step Valuation Process:
Step 1: Gather Historical Data (Go to MoneyControl → Ratios → Valuation)
| Year | EV (₹ Cr) | EV/EBITDA | EBITDA (Calc) | Growth % |
|---|---|---|---|---|
| 2020 | 50,000 | 18.5 | 2,703 | - |
| 2021 | 58,000 | 19.2 | 3,021 | +11.8% |
| 2022 | 65,000 | 18.8 | 3,457 | +14.4% |
| 2023 | 72,000 | 19.0 | 3,789 | +9.6% |
| 2024 | 80,000 | 18.5 | 4,324 | +14.1% |
Step 2: Calculate EBITDA for each year
- Formula: EBITDA = EV ÷ EV/EBITDA ratio
- Example 2024: 80,000 ÷ 18.5 = 4,324
Step 3: Determine Average EBITDA Growth
- Average of growth rates = (11.8 + 14.4 + 9.6 + 14.1) ÷ 4 = 12.5% average growth
Step 4: Forecast Next Year EBITDA
- Expected EBITDA (2025) = 4,324 × (1 + 0.125) = 4,865 Cr
Step 5: Calculate Forecasted Enterprise Value
- Forecasted EV = Expected EBITDA × Current EV/EBITDA
- Forecasted EV = 4,865 × 18.5 = 90,000 Cr
Step 6: Adjust for Debt to Get Equity Value
- Equity Value = Forecasted EV - Total Debt
- Equity Value = 90,000 - 15,000 = 75,000 Cr
Step 7: Calculate Target Price
- Target Price = Equity Value ÷ Outstanding Shares
- Target Price = 75,000 Cr ÷ 10 Cr shares = ₹750 per share
Step 8: Entry Price with Margin of Safety (30% discount)
- Recommended Entry = Target Price × 0.70
- Recommended Entry = 750 × 0.70 = ₹525
Final Verdict:
- Target Price: ₹750
- Buy if below: ₹525 (30% margin of safety)
- Current Price: ₹600 → BUY (below ₹750, room for upside)
Sector-Specific Analysis
Different industries require tailored analytical approaches:
Banks & NBFCs
Standard ratios DON’T apply to banks - Don’t check Debt:Equity ratio or operating cash flows. Instead focus on:
Banking-Specific Metrics:
1. CASA Ratio (Current Account + Savings Account)
| Metric | Formula | Good Value | Why It Matters |
|---|---|---|---|
| CASA Ratio | (CA + SA) ÷ Total Deposits × 100 | > 40% | Low-cost deposits = Higher profit margins |
Example: HDFC Bank CASA ~45% (Excellent), Small bank CASA ~25% (Poor)
2. NIM (Net Interest Margin)
| Metric | Formula | Good Value | Meaning |
|---|---|---|---|
| NIM | (Interest Income - Interest Expense) ÷ Earning Assets × 100 | > 3% | Spread between lending and borrowing rates |
Higher NIM = Bank earns more on each rupee lent
3. NPA Ratio (Non-Performing Assets)
| NPA Level | Ratio | Status | Action |
|---|---|---|---|
| Excellent | < 2% | ✅ | Strong asset quality |
| Acceptable | 2-3% | ⚠️ | Monitor trend |
| Poor | 3-5% | ❌ | High risk |
| Dangerous | > 5% | 🚫 | Avoid |
NPA = Loans not being repaid → Lower profits → Avoid banks with rising NPAs
FMCG Companies
Focus on inventory turnover - fast-moving goods should have high turnover ratios (8x+ annually).
Telecom Sector
Key Metric: ARPU (Average Revenue Per User)
Formula: ARPU = Total Revenue ÷ Total Subscribers
Example Calculation:
| Metric | Value |
|---|---|
| Monthly Revenue | ₹10,000 Crores |
| Active Subscribers | 35 Crore users |
| ARPU | ₹286/month/user |
Why ARPU Matters:
- Rising ARPU = Company increasing prices OR customers using more services
- Falling ARPU = Price war OR customers downgrading plans
- Compare quarter-over-quarter trends
Real Example:
- Jio ARPU: ₹175/month (rising trend = good)
- Airtel ARPU: ₹200/month (rising trend = excellent)
Infrastructure Companies
Key Metric: Order Book Analysis
Order book = Confirmed future projects/orders yet to be executed
Formula: Order Book to Revenue Ratio = Current Order Book ÷ Annual Revenue
Example:
| Metric | Amount (₹ Cr) |
|---|---|
| Current Order Book | 60,000 |
| Annual Revenue | 20,000 |
| Ratio | 3.0 |
Interpretation:
| Ratio | Status | Meaning |
|---|---|---|
| ≥ 3 | ⭐ Excellent | 3+ years of revenue visibility |
| 2-3 | ✅ Good | 2-3 years secured orders |
| 1-2 | ⚠️ Moderate | Limited visibility, needs new orders |
| < 1 | ❌ Poor | Less than 1 year work, risky |
Why it matters:
- Infrastructure projects take years to complete
- Higher order book = Predictable future revenue
- L&T typically maintains 2.5-3x order book
Industry & Economy Analysis
Economic Indicators Impact
GDP Growth - Aggregate economic output affecting overall market sentiment.
Repo Rate - RBI’s lending rate to banks influencing borrowing costs.
The Domino Effect of Repo Rate Increase:
- RBI increases Repo Rate (e.g., from 6% to 6.5%) ↓
- Banks increase lending rates (home loans, business loans become expensive) ↓
- Companies borrow less (expansion plans delayed) ↓
- Production decreases (less capacity addition) ↓
- GDP growth slows (economy cools down) ↓
- Stock market falls (negative sentiment)
Impact: Repo rate hike = Generally negative for stock markets Exception: Banking stocks may benefit (higher lending margins)
CRR (Cash Reserve Ratio) - Percentage of deposits banks must maintain with RBI.
SLR (Statutory Liquidity Ratio) - Percentage banks must keep in liquid assets.
Monetary Policy Impact on Markets:
| Factors Tightening | Impact Level | Market Sentiment | Action |
|---|---|---|---|
| 2-3 factors (CRR + SLR + Repo) | Strong | ❌ Negative | Be cautious, book profits |
| 1 factor | Moderate | ⚠️ Neutral | Sector-specific impact |
| 0 factors (cuts instead) | Accommodative | ✅ Positive | Good time to invest |
Balance of Payments (BoP)
Formula: BoP = Exports - Imports
Scenario Analysis:
Surplus BoP (Exports > Imports):
- Status: ✅ Trade Surplus
- Forex Impact: Rising foreign currency reserves
- Currency: Rupee strengthens
- Market Sentiment: Bullish for equity markets
- Example: India exports $50B, imports $45B → $5B surplus
Deficit BoP (Imports > Exports):
- Status: ❌ Trade Deficit
- Forex Impact: Depleting reserves
- Currency: Rupee weakens
- Market Sentiment: Cautious, potential FII outflows
- Example: India exports $40B, imports $55B → $15B deficit
Why it matters: Sustained deficits lead to rupee depreciation → Higher inflation → RBI forced to raise rates → Negative for markets
Cyclical Industries
Industries performing strongly during economic booms but struggling in recessions:
- Automobiles
- Real Estate
- Infrastructure
- Consumer Durables
Investment Strategy: Buy during recession lows, sell during boom peaks.
Management Quality Assessment
Quantitative metrics alone insufficient - qualitative management analysis critical:
Due Diligence Checklist:
1. Background Verification
- Google search: “[Company Name] + fraud” or “+ scam” or “+ cases”
- Check LinkedIn profiles of CEO, CFO, MD
- Verify educational credentials and past experience
- Research track record at previous companies
- Any past failures or regulatory issues?
2. Annual Report Deep Dive
- Read Management Discussion & Analysis (MD&A) section
- Understand future projects and strategic vision
- Check for penalties and regulatory actions disclosed
- Scrutinize Related Party Transactions (RPTs)
- High RPTs = Red flag (promoters doing self-dealing)
3. Auditor’s Report (First 3 pages of Annual Report)
- Look for phrase “True and Fair View” = Clean report
- Read Key Audit Matters (KAM) - Areas of concern
- Check for “Going Concern” issues
- Any Qualified Opinion = Major red flag, avoid!
4. Shareholding Pattern
- Promoter holding trends:
- Increasing = Good (confidence in business)
- Decreasing = Warning (promoters exiting?)
- Pledged shares:
- < 10% = Acceptable
- 20-50% = Caution
-
50% = Danger (promoters need cash badly)
- Check for insider trading charges
- Monitor bulk deals by promoters (selling or buying?)
5. Investor Communications
- Read quarterly earnings call transcripts
- How does management respond to tough questions?
- Do they provide clear guidance or dodge questions?
- Compare past promises vs actual delivery
Management Red Flags Checklist:
| Red Flag | Threshold | Severity | What It Means |
|---|---|---|---|
| Promoter selling heavily | > 5% reduction/year | 🚩 High | Loss of confidence in business |
| High pledged shares | > 50% pledged | 🚩 High | Desperate for cash, bankruptcy risk |
| Frequent auditor changes | > 1 change in 5 years | 🚩 Medium | Trying to hide something? |
| Qualified audit opinion | Any qualification | 🚩 Critical | AVOID immediately! |
| Insider trading cases | Any cases | 🚩 High | Unethical management |
| High Related Party Transactions | > 20% of revenue | 🚩 Medium | Self-dealing, siphoning money |
| Excessive mgmt compensation | > 10% of profits | 🚩 Medium | Enriching themselves |
Decision Matrix:
| Red Flags Count | Verdict | Action |
|---|---|---|
| 3 or more | ❌ AVOID | Don’t invest, too risky |
| 1-2 flags | ⚠️ INVESTIGATE | Dig deeper, understand context |
| 0 flags | ✅ CLEAN | Green signal for management quality |
Real Examples:
- Yes Bank: Multiple red flags ignored → Collapsed
- Satyam: Qualified audit opinion → Massive fraud
- Jet Airways: High debt + pledged shares → Bankruptcy
Consolidated vs Standalone Financials
Standalone Financial Statements - Parent company only (head office + domestic/international branches)
Consolidated Financial Statements - Includes:
- Parent company
- Subsidiary companies (>50% ownership)
- Associate companies (20-50% ownership)
- Joint ventures
Analysis Tip: Always analyze consolidated statements for complete business picture, especially for holding companies with significant subsidiaries.
Technical Analysis: Timing Your Entries
While fundamental analysis answers “What to buy?”, technical analysis answers “When to buy?”
Core Principles:
- Price Discounts Everything - All information reflected in price
- History Repeats Itself - Patterns recur due to human psychology
- Trends Exist - Prices move in identifiable directions
Candlestick Charting
Modern technical analysis relies on candlestick charts visualizing four key price points:
Candlestick Anatomy:
        │ ← Upper Shadow (High rejection)
        │
    ┌───────┐
    │       │ ← Body (Open to Close)
    │ BODY  │
    │       │
    └───────┘
        │
        │ ← Lower Shadow (Low rejection)
Four Key Prices:
- Open - Price at market open (9:15 AM)
- High - Highest price during the day
- Low - Lowest price during the day
- Close - Price at market close (3:30 PM)
Green/White Candle (Bullish):
- Close > Open
- Indicates buying pressure
- Bulls dominated the session
Red/Black Candle (Bearish):
- Open > Close
- Indicates selling pressure
- Bears dominated the session
Reading Candlesticks:
| Candle Type | Condition | Color | Meaning |
|---|---|---|---|
| Bullish | Close > Open | 🟢 Green | Buyers dominated, price rose |
| Bearish | Open > Close | 🔴 Red | Sellers dominated, price fell |
| Doji | Close = Open | ⚪ Neutral | Indecision, equal buyers/sellers |
Example Analysis:
Strong Bullish Candle:
- Open: ₹1,000
- High: ₹1,100
- Low: ₹990
- Close: ₹1,095
- Body: ₹95 (large green body)
- Upper Shadow: ₹5 (small rejection at top)
- Lower Shadow: ₹10 (buyers stepped in quickly)
- Interpretation: Strong buying pressure, bulls in control
Body Strength:
- Large body (>70% of range) = Strong conviction
- Medium body (40-70%) = Moderate movement
- Small body (<40%) = Weak, indecisive
Trend Identification
Uptrend - Series of higher highs and higher lows
Price going UP ↗
         H3 (Higher High)
        /
   H2  /
   /  /
  / L2 (Higher Low)
 /
H1
L1
Visual: Each peak is higher than the previous, each valley is higher than the previous
Downtrend - Series of lower highs and lower lows
Price going DOWN ↘
H1
 \
  H2 (Lower High)
   \
   L1
    \
     H3
      \
       L2 (Lower Low)
Visual: Each peak is lower than the previous, each valley is lower than the previous
Sideways/Ranging - Horizontal price movement within bounds
Resistance ────────────────
         ↕️ Range
Support  ────────────────
Visual: Price bounces between support and resistance, no clear direction
How to Identify Trends:
Check Last 5-10 Candles:
| Pattern Observed | Trend | Trading Action |
|---|---|---|
| Higher highs + Higher lows | ✅ UPTREND | Buy on dips to support |
| Lower highs + Lower lows | ❌ DOWNTREND | Avoid or short sell |
| Highs & lows in same range | ⚠️ SIDEWAYS | Wait for breakout |
Example:
Last 5 Days Data:
| Day | High | Low | Assessment |
|---|---|---|---|
| Day 1 | ₹100 | ₹95 | Starting point |
| Day 2 | ₹105 | ₹98 | Higher high, higher low ✓ |
| Day 3 | ₹108 | ₹102 | Higher high, higher low ✓ |
| Day 4 | ₹112 | ₹105 | Higher high, higher low ✓ |
| Day 5 | ₹115 | ₹108 | Higher high, higher low ✓ |
Verdict: Clear UPTREND → Consider buying on dips
Trading Rules:
- Never sell in an uptrend
- Never buy in a downtrend
- Never trade in sideways trend - wait for breakout
Support and Resistance Levels
Support - Price level where buying interest prevents further decline
Resistance - Price level where selling pressure prevents further rise
How to Find Support & Resistance:
Step 1: Look for Reversals
- Support = Price bounces UP from a level multiple times
- Resistance = Price bounces DOWN from a level multiple times
Visual Example:
₹550 ──────  Resistance (price can't break above)
     ↓ ↓ ↓
₹500 ─────── Current Price
     ↑ ↑ ↑
₹450 ──────  Support (price bounces up from here)
Finding Levels on Chart:
| Price Level | Touches | Type | Strength |
|---|---|---|---|
| ₹1,200 | 3 times, bounced down | Resistance | Strong |
| ₹1,100 | 5 times, bounced up | Support | Very Strong |
| ₹1,050 | 2 times, bounced up | Support | Moderate |
More touches = Stronger level
Breakout Analysis:
| Event | Volume | Signal | Action |
|---|---|---|---|
| Price crosses resistance UP | High volume | ✅ Breakout Confirmed | Buy signal |
| Price crosses resistance UP | Low volume | ⚠️ False breakout likely | Wait |
| Price crosses support DOWN | High volume | ❌ Breakdown Confirmed | Sell/Exit |
| Price crosses support DOWN | Low volume | ⚠️ False breakdown | Monitor |
Role Reversal:
- Broken resistance becomes new support
- Broken support becomes new resistance
Example: Stock at ₹100 resistance, breaks to ₹110. Now ₹100 acts as support!
Multi-Timeframe Analysis
The Father-Son-Grandson Analogy:
- Monthly Chart = Grandfather (long-term direction)
- Weekly Chart = Father (medium-term trend)
- Daily Chart = Son (entry/exit timing)
Strategy Decision Matrix:
| Monthly | Weekly | Daily | Signal | Action |
|---|---|---|---|---|
| UP | UP | UP | ⭐ STRONG BUY | All timeframes aligned - Highest probability |
| DOWN | DOWN | DOWN | ❌ STRONG SELL | All bearish - Stay away |
| UP | UP | DOWN | ✅ BUY ON DIP | Short-term pullback in uptrend - Good entry |
| UP | DOWN | DOWN | ⚠️ WAIT | Monthly positive but weakness appearing |
| DOWN | UP | UP | ⚠️ RISKY | Dead cat bounce? Be cautious |
| Mixed | Mixed | Mixed | 🚫 NO TRADE | Conflicting signals - Stay out |
Example Scenario:
Stock: TCS
- Monthly Chart: Clear uptrend (higher highs, higher lows)
- Weekly Chart: Uptrend continuing
- Daily Chart: Small correction/dip
Verdict: BUY ON DIP - Use daily dip as entry point in strong long-term uptrend
Why it works: Aligning timeframes increases probability - you’re buying in the direction of the bigger trend.
Bullish Candlestick Patterns
1. Bullish Engulfing
Day 1: Small Red Candle
Day 2: Large Green Candle completely engulfing Day 1

     ┌────┐
     │    │  ← Green candle
  ┌──┤    │
  │  │    │
  └──┤    │
     └────┘
Most powerful at downtrend bottom signaling reversal.
2. Morning Star
Three-candle pattern at downtrend bottom:

Day 1: Large Red Candle
Day 2: Small Doji (indecision)
Day 3: Large Green Candle

  ┌──┐
  │  │          ┌────┐
  │  │   ──     │    │
  │  │          │    │
  └──┘          └────┘
3. Hammer
Long lower shadow (2-3x body length)
Little/no upper shadow
Forms at downtrend bottom

     ┌─┐
     └─┘
      │
      │  ← Long shadow
      │
Hammer Identification:
Requirements:
- Lower shadow = 2-3x the body length
- Little to no upper shadow
- Color doesn’t matter
- Must appear at BOTTOM of downtrend
Example:
- Body (Open to Close): ₹20 range
- Lower Shadow: ₹60 range (3x body) ✓
- Upper Shadow: ₹2 (negligible) ✓
- Location: Bottom of downtrend ✓
- Next candle: Green confirmation ✓
Verdict: Valid HAMMER → Bullish reversal signal
Important Distinction:
| Pattern | Location | Signal |
|---|---|---|
| Hammer | Bottom of downtrend | Bullish reversal |
| Hanging Man | Top of uptrend | Bearish reversal |
Same shape, different meaning based on location!
4. Inverted Hammer
Long upper shadow (2-3x body)
Little/no lower shadow
At downtrend bottom

      │
      │  ← Long upper shadow
      │
     ┌─┐
     └─┘
Bearish Candlestick Patterns
1. Bearish Engulfing
Large red candle completely engulfing previous green candle, most powerful at uptrend peaks.
2. Evening Star
Three-candle pattern at uptrend top:

Day 1: Large Green Candle
Day 2: Small Doji (indecision)
Day 3: Large Red Candle
3. Shooting Star
Inverted Hammer at uptrend top = Bearish reversal

      │  ← Rejection of higher prices
      │
     ┌─┐
     └─┘
Technical Indicators
Moving Averages
Moving Averages - Smooth price data to identify trends
Two Types:
1. SMA (Simple Moving Average)
- Gives equal weight to all prices in the period
- Smoother but slower to react to price changes
- Good for identifying long-term trends
2. EMA (Exponential Moving Average)
- Gives more weight to recent prices
- Reacts faster to price changes
- Better for short-term trading signals
Standard EMA Periods:
| Timeframe | Short EMA | Medium EMA | Long EMA |
|---|---|---|---|
| Daily Chart | 5 days | 13 days | 26 days |
| Weekly Chart | 5 weeks | 13 weeks | 26 weeks |
| Monthly Chart | 5 months | 13 months | 26 months |
Trading Signals:
| EMA Position | Signal Type | Action |
|---|---|---|
| 5 EMA crosses above 13 EMA | 🟡 Anticipatory BUY | Early buy signal |
| 5 EMA above both 13 & 26 EMA | ✅ Confirmation BUY | Strong buy signal |
| 5 EMA crosses below 13 EMA | 🟡 Anticipatory SELL | Early sell signal |
| 5 EMA below both 13 & 26 EMA | ❌ Confirmation SELL | Strong sell signal |
| EMAs tangled/mixed | ⚠️ NO SIGNAL | Stay out, wait for clarity |
Visual Example:
Price Chart:
     /  ← 5 EMA (fastest, hugs price closely)
    / /  ← 13 EMA (medium speed)
   / /
  / / /  ← 26 EMA (slowest, smooth)
 / / /
When 5 EMA crosses above 13 EMA = Bulls taking control → Buy signal When 5 EMA crosses below 13 EMA = Bears taking control → Sell signal
Note: Moving averages are lagging indicators - they confirm trends after they’ve started, not predict them.
MACD (Moving Average Convergence Divergence)
MACD Components:
1. MACD Line (Blue) = 12-day EMA minus 26-day EMA 2. Signal Line (Orange) = 9-day EMA of MACD line 3. Histogram (Bars) = Difference between MACD and Signal line
How to Read MACD:
| Event | Meaning | Signal |
|---|---|---|
| MACD crosses above Signal line | Bullish momentum building | BUY |
| MACD crosses below Signal line | Bearish momentum building | SELL |
| MACD > 0 + Histogram growing | Strong bullish momentum | Hold/Buy more |
| MACD < 0 + Histogram shrinking | Strong bearish momentum | Sell/Avoid |
| Histogram near zero | Low momentum, indecision | Wait |
MACD Interpretation Guide:
| MACD Reading | Histogram | Meaning | Action |
|---|---|---|---|
| MACD > 0 | Increasing | Strong bullish momentum | Hold/Buy |
| MACD > 0 | Decreasing | Weakening but still positive | Be alert |
| MACD < 0 | Decreasing | Strong bearish momentum | Avoid/Sell |
| MACD < 0 | Increasing | Weakness reducing | Possible reversal soon |
Divergence Signals (Advanced):
Bearish Divergence:
- Price makes new HIGH
- MACD makes lower HIGH
- Signal: Momentum weakening → Sell warning
Bullish Divergence:
- Price makes new LOW
- MACD makes higher LOW
- Signal: Momentum strengthening → Buy potential
Real Example:
- Stock rises from ₹100 → ₹120 → ₹130
- MACD: 2.5 → 2.0 → 1.5 (decreasing despite price rising)
- Warning: Price up but momentum down → Reversal coming!
Volume Analysis
Volume confirms or denies price movements - Never trade without checking volume!
The Volume Confirmation Matrix:
| Price Movement | Volume | Signal | Interpretation | Action |
|---|---|---|---|---|
| ⬆️ Rising | 📊 High (>50% above 5-day avg) | ✅ STRONG BUY | Smart money accumulating | Buy confidently |
| ⬆️ Rising | 📉 Low (below average) | ⚠️ WEAK RALLY | Suspect move, may reverse | Be cautious |
| ⬇️ Falling | 📊 High (>50% above avg) | ❌ STRONG SELL | Smart money distributing | Exit positions |
| ⬇️ Falling | 📉 Low (below average) | ⚠️ WEAK DECLINE | May reverse soon | Don’t panic sell |
| Flat | Normal | 🟰 NEUTRAL | No clear signal | Wait and watch |
How to Check Volume:
- Look at volume bars below price chart
- Compare today’s volume with previous 5-day average
- Volume surge = Today’s volume > 1.5x average (50% higher)
Example:
- Last 5 days average volume: 10 lakh shares/day
- Today’s volume: 18 lakh shares (1.8x average) ✓ Volume surge!
- Price: Rose 3%
- Verdict: Strong buy signal - Institutions accumulating
Remember: Price can be manipulated, volume harder to fake. Trust moves with volume!
Practical Trading Framework
Combining ALL Indicators for Best Results:
Step-by-Step Analysis Checklist:
1. ✅ Identify Trend
- Check last 5-10 candles
- Determine: Uptrend / Downtrend / Sideways
2. ✅ Mark Support & Resistance
- Find levels where price bounced multiple times
- Note breakout/breakdown points
3. ✅ Check EMA Signals
- Is 5 EMA above or below 13 & 26 EMA?
- Any crossovers recently?
4. ✅ Analyze MACD
- MACD above or below signal line?
- Histogram increasing or decreasing?
5. ✅ Confirm with Volume
- Is volume above 5-day average?
- High volume on up move = Good
- High volume on down move = Bad
6. ✅ Check Candlestick Pattern
- Any reversal patterns (Hammer, Engulfing)?
- Strong body or weak/indecisive?
Signal Scoring System:
| Buy Signals | Sell Signals | Trend | Final Decision |
|---|---|---|---|
| 2+ signals | 0 signals | Uptrend | ⭐ STRONG BUY |
| 1 signal | 0 signals | Not downtrend | ✅ MODERATE BUY |
| 0 signals | 2+ signals | Downtrend | ❌ STRONG SELL |
| 0 signals | 1 signal | Not uptrend | ⚠️ MODERATE SELL |
| Mixed | Mixed | Any | 🟰 HOLD - Wait for clarity |
Example Analysis:
Stock: Infosys
- ✅ Trend: Uptrend (higher highs, higher lows)
- ✅ EMA: 5 EMA crossed above 13 EMA (+1 buy)
- ✅ MACD: Positive and rising (+1 buy)
- ✅ Volume: 150% of average (+1 buy)
- ✅ Candle: Green bullish candle
- ❌ Sell signals: 0
Result: 3 buy signals, 0 sell signals, uptrend → STRONG BUY
Putting It All Together: Holistic Investment Framework
The Complete Analysis Workflow
Your 4-Step Investment Process:
Step 1: Fundamental Screening ✅ or ❌
- Run all 8 Golden Ratios analysis
- Check 5-year trends (Reserves, FCF, EPS growing?)
- Verify sector-specific metrics
- Assess management quality (red flags?)
Decision:
- ✅ Passed → Proceed to Step 2
- ❌ Failed → REJECT - Move to next stock
Step 2: Valuation Analysis 💰
- Calculate intrinsic value using EV/EBITDA method
- Compare company P/E with industry average
- Check Price-to-Book ratio
- Determine target price with 30% margin of safety
Decision:
- ✅ Undervalued (current price < target) → Proceed to Step 3
- ⚠️ Overvalued → WATCHLIST - Wait for price correction
Step 3: Economy & Industry Check 🌍
- GDP growth trajectory (expanding or slowing?)
- Interest rate environment (rates rising/falling?)
- Industry lifecycle stage (growth/maturity/decline?)
- Regulatory environment (favorable/unfavorable?)
Decision:
- ✅ Favorable macro → Proceed to Step 4
- ❌ Unfavorable → DEFER - Wrong timing, wait
Step 4: Technical Entry Timing 📈
- Identify trend (buy only in UPTREND or consolidation)
- Mark support and resistance levels
- Wait for EMA crossover (5 EMA crossing 13/26)
- Confirm with MACD and volume surge
- Use candlestick patterns for precise entry point
- Set STOP LOSS before buying
Decision: ✅ Execute trade with predefined stop loss
Summary: All 4 steps must align for investment. Skip any step = Higher risk!
Risk Management Rules
The Golden Rules:
| Rule | Limit | Why It Matters |
|---|---|---|
| Max Risk Per Trade | 2% of portfolio | One bad trade won’t destroy your capital |
| Max Position Size | 10% per stock | Diversification, one stock can’t sink you |
| Risk-Reward Ratio | Minimum 1:2 | For every ₹1 risked, target ₹2 profit |
Position Sizing Example:
Your Portfolio: ₹10,00,000
Trade Details:
- Entry Price: ₹500
- Stop Loss: ₹475 (5% below entry)
- Risk per share: ₹25
Calculation:
| Step | Calculation | Result |
|---|---|---|
| Max risk allowed | ₹10,00,000 × 2% | ₹20,000 |
| Shares by risk | ₹20,000 ÷ ₹25 | 800 shares |
| Max position value | ₹10,00,000 × 10% | ₹1,00,000 |
| Shares by position limit | ₹1,00,000 ÷ ₹500 | 200 shares |
| ACTUAL shares to buy | Take LOWER of above | 200 shares |
| Investment | 200 × ₹500 | ₹1,00,000 |
| Max loss if SL hit | 200 × ₹25 | ₹5,000 (0.5% of portfolio) ✅ |
Stop Loss Strategies:
| Strategy | Method | Example (Entry ₹500) |
|---|---|---|
| Technical | Below support level | Support at ₹480 → SL at ₹475 |
| Percentage | Fixed % (5-7%) | 7% below → SL at ₹465 |
| ATR-based | Based on volatility | High volatility → Wider SL |
Risk-Reward Calculation:
Given:
- Entry: ₹500
- Stop Loss: ₹475
- Risk: ₹25 per share
Targets:
| Target | Calculation | Price | Reward | Risk:Reward |
|---|---|---|---|---|
| Target 1 | Entry + (Risk × 2) | ₹550 | ₹50 | 1:2 ✅ |
| Target 2 | Entry + (Risk × 3) | ₹575 | ₹75 | 1:3 ⭐ |
Visual:
₹575 ──── Target 2 (+₹75 profit, 1:3)
₹550 ──── Target 1 (+₹50 profit, 1:2)
₹500 ──── Entry Price
₹475 ──── Stop Loss (-₹25 loss)
Rule: Never take a trade where potential loss exceeds potential gain!
Portfolio Construction Principles
Diversification by Market Cap:
| Risk Profile | Large Cap | Mid Cap | Small Cap | Suitable For |
|---|---|---|---|---|
| Conservative | 70% | 20% | 10% | Retirees, low risk tolerance |
| Moderate | 50% | 35% | 15% | Most investors, balanced approach |
| Aggressive | 30% | 40% | 30% | Young investors, high risk appetite |
Example Portfolio: ₹10 Lakhs (Moderate Profile)
| Category | Allocation | Amount | Example Stocks |
|---|---|---|---|
| Large Cap | 50% | ₹5,00,000 | HDFC Bank, Reliance, TCS, Infosys |
| Mid Cap | 35% | ₹3,50,000 | L&T Technology, Mphasis, Persistent |
| Small Cap | 15% | ₹1,50,000 | High growth smallcaps (2-3 stocks max) |
Portfolio Guidelines:
| Parameter | Recommended Value | Why |
|---|---|---|
| Number of stocks | 10-15 stocks | Optimal diversification without over-diversification |
| Max per stock | 10% of portfolio | No single stock risk |
| Max per sector | 25% of portfolio | Sector risk mitigation |
| Review frequency | Quarterly | Track performance, rebalance if needed |
Sector Diversification Example (₹10L Portfolio):
| Sector | Allocation | Max Amount |
|---|---|---|
| Banking/Finance | 25% | ₹2,50,000 |
| IT/Technology | 20% | ₹2,00,000 |
| FMCG | 15% | ₹1,50,000 |
| Pharma | 15% | ₹1,50,000 |
| Auto/Manufacturing | 15% | ₹1,50,000 |
| Others | 10% | ₹1,00,000 |
Remember: Don’t put all eggs in one basket. Diversify, but don’t over-diversify!
Key Principles Summary
Fundamental Analysis Commandments:
- Quality Over Quantity: Own 10-15 well-researched stocks, not 50 random picks
- Circle of Competence: Invest only in businesses you understand
- Management Matters: Honest management with skin in the game is non-negotiable
- Margin of Safety: Buy at significant discount to intrinsic value
- Long-term Horizon: Compounding requires patience - minimum 3-5 years
Technical Analysis Commandments:
- Trend is Friend: Only buy in uptrends, only short in downtrends
- Volume Confirms Price: Price movements without volume are suspect
- Support Becomes Resistance: Levels flip roles after breaks
- Multiple Timeframe Alignment: Higher probability when all timeframes agree
- Stop Losses Are Mandatory: Never trade without predefined exit
Risk Management Commandments:
- Never Risk More Than 2%: Per trade portfolio risk limit
- Position Sizing Discipline: No single stock above 10% of portfolio
- Cut Losses Quickly: Stop loss hit = Exit immediately, no hoping
- Let Winners Run: Trail stop losses on profitable positions
- Diversify Across Sectors: No sector above 25% portfolio weight
Advanced Concepts and Nuances
IPO Analysis Framework
Beyond regular fundamental analysis, IPOs need special scrutiny:
IPO Evaluation Checklist:
| Parameter | Green Flag ✅ | Red Flag ❌ | Why It Matters |
|---|---|---|---|
| OFS vs Fresh Issue | Fresh Issue > 50% | OFS > 50% | Fresh = Growth capital, OFS = Promoters exiting |
| Grey Market Premium | GMP > 20% above upper band | GMP < 0 (discount) | Indicates market demand |
| Retail Subscription | RII > 3x subscribed | RII < 1x | Retail investor interest |
| QIB Subscription | QIB > 1x | QIB < 1x | Institutional confidence |
| P/E vs Industry | Company P/E < Industry P/E | Company P/E > Industry P/E | Valuation attractiveness |
| Min Subscription | Total > 90% | Total < 90% | Will it list? |
Scoring System:
| Green Flags | Red Flags | Verdict | Action |
|---|---|---|---|
| 4-6 | 0-1 | ⭐ STRONG | Apply for maximum shares |
| 2-3 | 1-2 | ⚠️ MODERATE | Small allocation, risky |
| 0-1 | 3+ | ❌ AVOID | Don’t apply, too many concerns |
Real Example: Zomato IPO
- ✅ Fresh Issue: 60% (raising growth capital)
- ✅ GMP: ₹50 premium (strong demand)
- ✅ RII: 7.45x (retail crazy about it)
- ✅ QIB: 51.79x (institutions love it)
- ⚠️ P/E: Loss-making (no comparison possible)
- ✅ Subscription: 38x overall
Score: 4-5 green flags → APPLY (and it listed at good premium!)
Book Value and Asset Plays
Book Value = What shareholders would get if company sold everything and paid all debts
Formula: Book Value = (Total Assets - External Liabilities) ÷ Total Shares
Calculation Example:
| Component | Amount (₹ Cr) |
|---|---|
| Current Assets | 5,000 |
| Non-Current Assets | 15,000 |
| Total Assets | 20,000 |
| Current Liabilities | 3,000 |
| Non-Current Liabilities | 7,000 |
| Total Liabilities | 10,000 |
| Book Value (Assets - Liabilities) | 10,000 |
| Total Outstanding Shares | 100 Cr |
| Book Value per Share | ₹100 |
Price to Book (P/B) Ratio:
| P/B Ratio | Market Price | Interpretation |
|---|---|---|
| < 1 | ₹80 (below ₹100 BV) | Trading below book - Distressed or value opportunity |
| 1-3 | ₹150 (1.5x BV) | Reasonable valuation for assets |
| > 3 | ₹400 (4x BV) | Premium - Growth/brand value priced in |
When Book Value Matters:
- Asset-heavy businesses: Real estate, manufacturing, infrastructure
- Banks: P/B ratio more relevant than P/E
- Distressed situations: Bankruptcy, asset sales
When Book Value Doesn’t Matter:
- IT/Services: No physical assets, all intellectual property
- Growth companies: Future potential > Current assets
- Consumer brands: Brand value not on balance sheet
Example: Page Industries (Jockey brand) trades at 20+ P/B because brand value » physical assets!
Behavioral Pitfalls to Avoid
Your worst enemy in markets? YOUR OWN BRAIN! Here are common biases:
1. Recency Bias - Overweighting recent performance
| Situation | Bias | Reality Check |
|---|---|---|
| Won 4 out of last 5 trades | “I’m a genius! Can’t lose!” | ⚠️ Overconfidence leads to bigger bets → Bigger losses |
| Lost last 3 trades | “I’m terrible at this!” | ⚠️ Small sample, doesn’t define skill |
Action: Track 50+ trades before judging your skill. Stay disciplined regardless of recent results.
2. Loss Aversion - Holding losers too long, selling winners too early
| Scenario | Emotional Response | Rational Action |
|---|---|---|
| Stock at ₹100, now ₹80 (20% loss) | “Can’t sell at loss, will hold till breakeven” | ❌ Exit at stop loss, capital can work elsewhere |
| Stock at ₹100, now ₹120 (20% profit) | “Better book profit before it falls!” | ✅ OK to book, but let winners run with trailing SL |
Rule: Cut losses quickly, let profits run. Don’t marry your losers!
3. Herd Mentality (FOMO) - Buying because everyone else is
| Red Flag | What You See | What You Should Do |
|---|---|---|
| Stock all over Twitter/WhatsApp | “Everyone’s buying, I’ll miss out!” | 🛑 STOP! Do independent analysis |
| “Hot tip” from 5 different people | “Must be true if everyone says it” | 🛑 Usually means you’re late |
| Social media mentions 3x normal | Extreme hype | 🛑 Often marks the top |
Real Example: When your barber gives you stock tips, market top is near!
4. Anchoring - Fixating on past price levels
| Anchor Point | Biased Thinking | Reality |
|---|---|---|
| Stock at ₹200 (52W high), now ₹100 | “It’s cheap! Was ₹200!” | ❌ Maybe business deteriorated, ₹100 is fair |
| Bought at ₹150, now ₹120 | “Won’t sell till ₹150” | ❌ Your buy price is irrelevant to market |
| IPO price ₹100, trading ₹80 | “Will go back to ₹100” | ❌ Market doesn’t care about IPO price |
Truth: Analyze CURRENT fundamentals, not past prices. Market doesn’t remember your cost!
Self-Check Questions:
Before ANY trade, ask yourself:
- ❓ Am I buying because of analysis or emotions?
- ❓ Would I buy more if everyone was selling it?
- ❓ Would I sell some if everyone was selling it?
- ❓ Is my overconfidence from a few lucky wins?
Be honest. Your portfolio will thank you!
Continuous Learning Resources
The journey of mastering equity markets involves continuous learning and adaptation. Here are critical practices:
1. Daily Habits:
- Read financial newspapers (Economic Times, Business Standard)
- Track key indices and sector movements
- Review your portfolio and update watchlists
- Journal all trades with reasoning and emotions
2. Weekly Rituals:
- Analyze quarterly results of portfolio companies
- Screen for new investment opportunities
- Review technical charts on weekly timeframe
- Calculate portfolio returns and risk metrics
3. Monthly Discipline:
- Read annual reports of target companies
- Attend investor conference calls
- Rebalance portfolio if needed
- Review and learn from past mistakes
4. Continuous Education:
- Follow quality content creators (as referenced in the fundamentals)
- Study case studies of successful investors
- Understand macroeconomic indicators deeply
- Keep updating valuation models with new data
Final Thoughts: The Investing Mindset
This comprehensive exploration of equity markets provides the foundation for building wealth through equities. Key principles to internalize:
1. Analysis Over Emotion: Every investment decision must stem from rigorous analysis, not tips, FOMO, or greed.
2. Patience Compounds Wealth: The real money is made by holding quality businesses for years, not trading frequently.
3. Risk Management is Everything: Capital preservation comes before capital appreciation - you can’t compound if you blow up.
4. Continuous Learning: Markets evolve, businesses change, regulations shift - stay curious and adaptive.
5. Know What You Own: If you can’t explain why you own a stock, you shouldn’t own it.
6. Humility: The market is supreme. When proven wrong, accept it quickly and move on.
The difference between gambling and investing lies not in the assets themselves, but in your approach. Armed with fundamental analysis for selection, technical analysis for timing, you can expect to make money in the long run.