Welcome to the third and final part of the series. In this article, we will cover the stuff which is sterotypically shown in the movies and shows that is associated with the stock market.
Technical Analysis answers: “WHEN to buy?”
We will go deep into this in the third post of the series, but for now think of technical analysis as the Google Maps of the market.
- Fundamentals tell you which city is worth moving to
- Technicals help you pick which lane to take and where to turn
What it is: Studying price charts, patterns, and trading volume to identify the right time to enter or exit positions.
What it uses:
- Price charts (candlesticks, patterns, trends)
- Technical indicators (EMA, MACD, RSI)
- Volume analysis
- Support and resistance levels
What it determines:
- Is the stock in uptrend, downtrend, or sideways?
- Where are the key support/resistance levels?
- What’s the optimal entry and exit price?
When to use:
- Timing your entry/exit - Getting the best price for buying/selling
- Riding momentum - Catching stocks in strong trends
- Risk management - Setting precise stop loss levels
- Short-term trading - Intraday or swing trading strategies
The Power of Technical Analysis:
Advantage #1: Works on ANY Stock
- Don’t need to understand the business deeply
- Can trade sectors you’re not expert in
- Even works on stocks with no fundamentals (penny stocks, momentum plays)
Advantage #2: Faster Decisions
- Fundamental analysis takes hours/days (reading annual reports, calculating ratios)
- Technical analysis takes minutes (check chart, indicators, volume)
- Perfect for part-time investors with day jobs
Advantage #3: Clear Entry/Exit Rules
- Fundamentals say “TCS is a good company” but don’t tell you when to buy
- Technicals say “Buy TCS at ₹3,450 support, sell at ₹3,650 resistance” - Specific!
Advantage #4: Risk Management
- Fundamentals can’t tell you where to place stop loss
- Technicals give you exact levels based on support zones
Advantage #5: Works in Bear Markets Too
- Fundamental investors struggle when everything falls
- Technical traders can short sell and profit from falling prices
The BEST Approach: Combine Both!
| Step | Use | Reason |
|---|---|---|
| Step 1 | Fundamental Analysis | Find 10-15 quality stocks worth owning |
| Step 2 | Technical Analysis | From those 10-15, pick ones showing bullish chart patterns |
| Step 3 | Buy with technical entry | Get best price using support levels |
| Step 4 | Hold with fundamental confidence | Don’t panic on small dips, business is strong |
Real Example:
Asian Paints Analysis:
- ✅ Fundamental Check: ROCE 35%, debt-free, consistent profit growth → Quality stock
- ⚠️ Current Price: ₹3,200
- 📉 Technical Check: Stock in downtrend, 5 EMA below 13 EMA, breaking support
- Decision: Good company, WRONG time. Wait for uptrend reversal.
- Action: Add to watchlist, buy when chart turns bullish (maybe at ₹2,900 support)
The Mistake Most Investors Make:
- Buying fundamentally strong stocks at technically wrong levels
- Result: Stuck in losses for months even though company is great
- Solution: Use fundamentals to pick stocks, technicals to time entries
Core Principles:
- Price Discounts Everything - All information reflected in price
- History Repeats Itself - Patterns recur due to human psychology
- Trends Exist - Prices move in identifiable directions
Candlestick Charting
Modern technical analysis relies on candlestick charts visualizing four key price points:
Candlestick Anatomy:
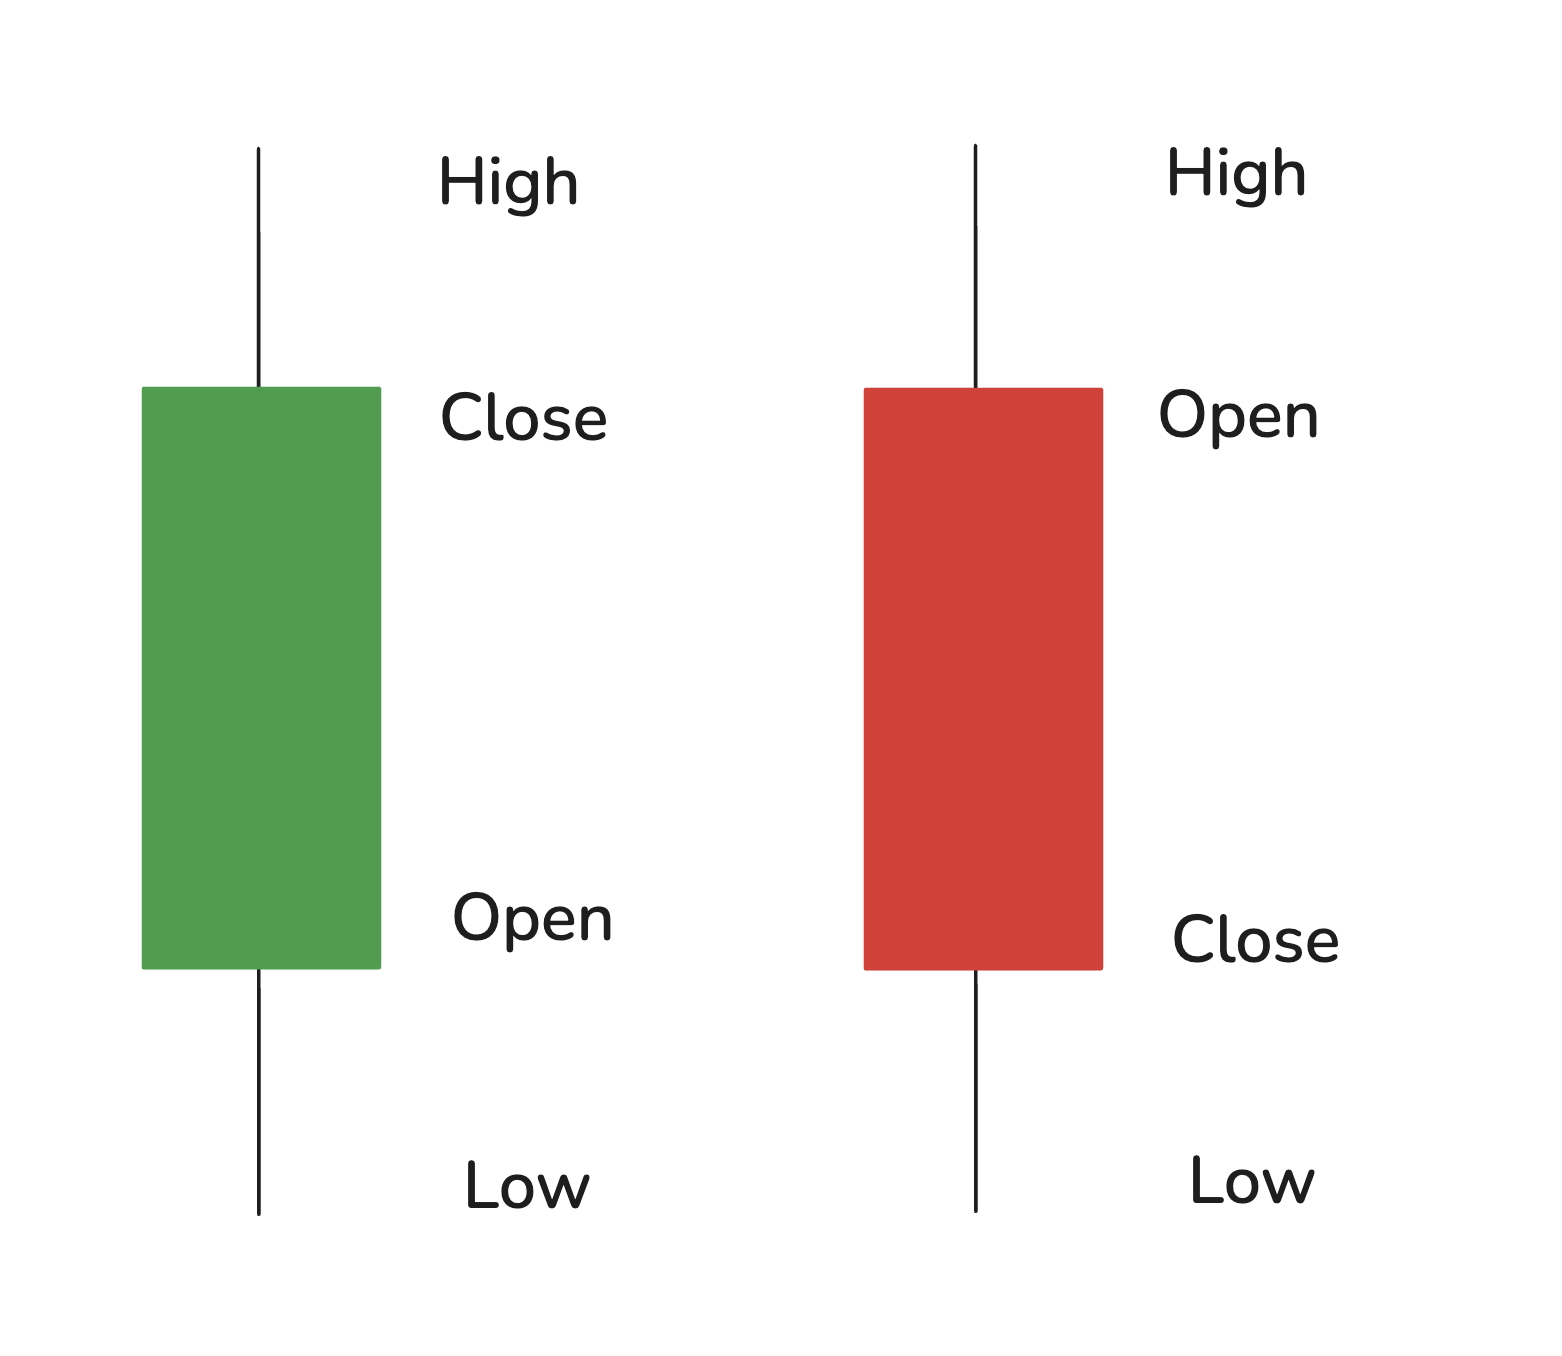
Four Key Prices:
- Open - Price at market open (9:15 AM)
- High - Highest price during the day
- Low - Lowest price during the day
- Close - Price at market close (3:30 PM)
Green/White Candle (Bullish):
- Close > Open
- Indicates buying pressure
- Bulls dominated the session
Red/Black Candle (Bearish):
- Open > Close
- Indicates selling pressure
- Bears dominated the session
Reading Candlesticks:
| Candle Type | Condition | Color | Meaning |
|---|---|---|---|
| Bullish | Close > Open | 🟢 Green | Buyers dominated, price rose |
| Bearish | Open > Close | 🔴 Red | Sellers dominated, price fell |
| Doji | Close = Open | ⚪ Neutral | Indecision, equal buyers/sellers |
Example Analysis:
Strong Bullish Candle:
- Open: ₹1,000
- High: ₹1,100
- Low: ₹990
- Close: ₹1,095
- Body: ₹95 (large green body)
- Upper Shadow: ₹5 (small rejection at top)
- Lower Shadow: ₹10 (buyers stepped in quickly)
- Interpretation: Strong buying pressure, bulls in control
Body Strength:
- Large body (>70% of range) = Strong conviction
- Medium body (40-70%) = Moderate movement
- Small body (<40%) = Weak, indecisive
Trend Identification
Uptrend - Series of higher highs and higher lows
Price going UP ↗
         H3 (Higher High)
        /
   H2  /
   /  /
  / L2 (Higher Low)
 /
H1
L1
Visual: Each peak is higher than the previous, each valley is higher than the previous
Downtrend - Series of lower highs and lower lows
Price going DOWN ↘
H1

  H2 (Lower High)

   L1

     H3

       L2 (Lower Low)
Visual: Each peak is lower than the previous, each valley is lower than the previous
Sideways/Ranging - Horizontal price movement within bounds
Resistance ────────────────
         ↕️ Range
Support  ────────────────
Visual: Price bounces between support and resistance, no clear direction
How to Identify Trends:
Check Last 5-10 Candles:
| Pattern Observed | Trend | Trading Action |
|---|---|---|
| Higher highs + Higher lows | ✅ UPTREND | Buy on dips to support |
| Lower highs + Lower lows | ❌ DOWNTREND | Avoid or short sell |
| Highs & lows in same range | ⚠️ SIDEWAYS | Wait for breakout |
Example:
Last 5 Days Data:
| Day | High | Low | Assessment |
|---|---|---|---|
| Day 1 | ₹100 | ₹95 | Starting point |
| Day 2 | ₹105 | ₹98 | Higher high, higher low ✓ |
| Day 3 | ₹108 | ₹102 | Higher high, higher low ✓ |
| Day 4 | ₹112 | ₹105 | Higher high, higher low ✓ |
| Day 5 | ₹115 | ₹108 | Higher high, higher low ✓ |
Verdict: Clear UPTREND → Consider buying on dips
Trading Rules:
- Never sell in an uptrend
- Never buy in a downtrend
- Never trade in sideways trend - wait for breakout
Support and Resistance Levels
Support - Price level where buying interest prevents further decline
Resistance - Price level where selling pressure prevents further rise
How to Find Support & Resistance:
Step 1: Look for Reversals
- Support = Price bounces UP from a level multiple times
- Resistance = Price bounces DOWN from a level multiple times
Visual Example:
₹550 ──────  Resistance (price can't break above)
     ↓ ↓ ↓
₹500 ─────── Current Price
     ↑ ↑ ↑
₹450 ──────  Support (price bounces up from here)
Finding Levels on Chart:
| Price Level | Touches | Type | Strength |
|---|---|---|---|
| ₹1,200 | 3 times, bounced down | Resistance | Strong |
| ₹1,100 | 5 times, bounced up | Support | Very Strong |
| ₹1,050 | 2 times, bounced up | Support | Moderate |
More touches = Stronger level
Breakout Analysis:
| Event | Volume | Signal | Action |
|---|---|---|---|
| Price crosses resistance UP | High volume | ✅ Breakout Confirmed | Buy signal |
| Price crosses resistance UP | Low volume | ⚠️ False breakout likely | Wait |
| Price crosses support DOWN | High volume | ❌ Breakdown Confirmed | Sell/Exit |
| Price crosses support DOWN | Low volume | ⚠️ False breakdown | Monitor |
Role Reversal:
- Broken resistance becomes new support
- Broken support becomes new resistance
Example: Stock at ₹100 resistance, breaks to ₹110. Now ₹100 acts as support!
Multi-Timeframe Analysis
The Father-Son-Grandson Analogy:
- Monthly Chart = Grandfather (long-term direction)
- Weekly Chart = Father (medium-term trend)
- Daily Chart = Son (entry/exit timing)
Strategy Decision Matrix:
| Monthly | Weekly | Daily | Signal | Action |
|---|---|---|---|---|
| UP | UP | UP | ⭐ STRONG BUY | All timeframes aligned - Highest probability |
| DOWN | DOWN | DOWN | ❌ STRONG SELL | All bearish - Stay away |
| UP | UP | DOWN | ✅ BUY ON DIP | Short-term pullback in uptrend - Good entry |
| UP | DOWN | DOWN | ⚠️ WAIT | Monthly positive but weakness appearing |
| DOWN | UP | UP | ⚠️ RISKY | Dead cat bounce? Be cautious |
| Mixed | Mixed | Mixed | 🚫 NO TRADE | Conflicting signals - Stay out |
Example Scenario:
Stock: TCS
- Monthly Chart: Clear uptrend (higher highs, higher lows)
- Weekly Chart: Uptrend continuing
- Daily Chart: Small correction/dip
Verdict: BUY ON DIP - Use daily dip as entry point in strong long-term uptrend
Why it works: Aligning timeframes increases probability - you’re buying in the direction of the bigger trend.
Bullish Candlestick Patterns
1. Bullish Engulfing
Day 1: Small Red Candle
Day 2: Large Green Candle completely engulfing Day 1

     ┌────┐
     │    │  ← Green candle
  ┌──┤    │
  │  │    │
  └──┤    │
     └────┘
Most powerful at downtrend bottom signaling reversal.
2. Morning Star
Three-candle pattern at downtrend bottom:

Day 1: Large Red Candle
Day 2: Small Doji (indecision)
Day 3: Large Green Candle

  ┌──┐
  │  │          ┌────┐
  │  │   ──     │    │
  │  │          │    │
  └──┘          └────┘
3. Hammer
Long lower shadow (2-3x body length)
Little/no upper shadow
Forms at downtrend bottom

     ┌─┐
     └─┘
      │
      │  ← Long shadow
      │
Hammer Identification:
Requirements:
- Lower shadow = 2-3x the body length
- Little to no upper shadow
- Color doesn’t matter
- Must appear at BOTTOM of downtrend
Example:
- Body (Open to Close): ₹20 range
- Lower Shadow: ₹60 range (3x body) ✓
- Upper Shadow: ₹2 (negligible) ✓
- Location: Bottom of downtrend ✓
- Next candle: Green confirmation ✓
Verdict: Valid HAMMER → Bullish reversal signal
Important Distinction:
| Pattern | Location | Signal |
|---|---|---|
| Hammer | Bottom of downtrend | Bullish reversal |
| Hanging Man | Top of uptrend | Bearish reversal |
Same shape, different meaning based on location!
4. Inverted Hammer
Long upper shadow (2-3x body)
Little/no lower shadow
At downtrend bottom

      │
      │  ← Long upper shadow
      │
     ┌─┐
     └─┘
Bearish Candlestick Patterns
1. Bearish Engulfing
Large red candle completely engulfing previous green candle, most powerful at uptrend peaks.
2. Evening Star
Three-candle pattern at uptrend top:

Day 1: Large Green Candle
Day 2: Small Doji (indecision)
Day 3: Large Red Candle
3. Shooting Star
Inverted Hammer at uptrend top = Bearish reversal

      │  ← Rejection of higher prices
      │
     ┌─┐
     └─┘
Technical Indicators
Moving Averages
Moving Averages - Smooth price data to identify trends
Two Types:
1. SMA (Simple Moving Average)
- Gives equal weight to all prices in the period
- Smoother but slower to react to price changes
- Good for identifying long-term trends
2. EMA (Exponential Moving Average)
- Gives more weight to recent prices
- Reacts faster to price changes
- Better for short-term trading signals
Standard EMA Periods:
| Timeframe | Short EMA | Medium EMA | Long EMA |
|---|---|---|---|
| Daily Chart | 5 days | 13 days | 26 days |
| Weekly Chart | 5 weeks | 13 weeks | 26 weeks |
| Monthly Chart | 5 months | 13 months | 26 months |
Trading Signals:
| EMA Position | Signal Type | Action |
|---|---|---|
| 5 EMA crosses above 13 EMA | 🟡 Anticipatory BUY | Early buy signal |
| 5 EMA above both 13 & 26 EMA | ✅ Confirmation BUY | Strong buy signal |
| 5 EMA crosses below 13 EMA | 🟡 Anticipatory SELL | Early sell signal |
| 5 EMA below both 13 & 26 EMA | ❌ Confirmation SELL | Strong sell signal |
| EMAs tangled/mixed | ⚠️ NO SIGNAL | Stay out, wait for clarity |
Visual Example:
Price Chart:
     /  ← 5 EMA (fastest, hugs price closely)
    / /  ← 13 EMA (medium speed)
   / /
  / / /  ← 26 EMA (slowest, smooth)
 / / /
When 5 EMA crosses above 13 EMA = Bulls taking control → Buy signal When 5 EMA crosses below 13 EMA = Bears taking control → Sell signal
Note: Moving averages are lagging indicators - they confirm trends after they’ve started, not predict them.
MACD (Moving Average Convergence Divergence)
MACD Components:
1. MACD Line (Blue) = 12-day EMA minus 26-day EMA 2. Signal Line (Orange) = 9-day EMA of MACD line 3. Histogram (Bars) = Difference between MACD and Signal line
How to Read MACD:
| Event | Meaning | Signal |
|---|---|---|
| MACD crosses above Signal line | Bullish momentum building | BUY |
| MACD crosses below Signal line | Bearish momentum building | SELL |
| MACD > 0 + Histogram growing | Strong bullish momentum | Hold/Buy more |
| MACD < 0 + Histogram shrinking | Strong bearish momentum | Sell/Avoid |
| Histogram near zero | Low momentum, indecision | Wait |
MACD Interpretation Guide:
| MACD Reading | Histogram | Meaning | Action |
|---|---|---|---|
| MACD > 0 | Increasing | Strong bullish momentum | Hold/Buy |
| MACD > 0 | Decreasing | Weakening but still positive | Be alert |
| MACD < 0 | Decreasing | Strong bearish momentum | Avoid/Sell |
| MACD < 0 | Increasing | Weakness reducing | Possible reversal soon |
Divergence Signals (Advanced):
Bearish Divergence:
- Price makes new HIGH
- MACD makes lower HIGH
- Signal: Momentum weakening → Sell warning
Bullish Divergence:
- Price makes new LOW
- MACD makes higher LOW
- Signal: Momentum strengthening → Buy potential
Real Example:
- Stock rises from ₹100 → ₹120 → ₹130
- MACD: 2.5 → 2.0 → 1.5 (decreasing despite price rising)
- Warning: Price up but momentum down → Reversal coming!
Volume Analysis
Volume confirms or denies price movements - Never trade without checking volume!
The Volume Confirmation Matrix:
| Price Movement | Volume | Signal | Interpretation | Action |
|---|---|---|---|---|
| ⬆️ Rising | 📊 High (>50% above 5-day avg) | ✅ STRONG BUY | Smart money accumulating | Buy confidently |
| ⬆️ Rising | 📉 Low (below average) | ⚠️ WEAK RALLY | Suspect move, may reverse | Be cautious |
| ⬇️ Falling | 📊 High (>50% above avg) | ❌ STRONG SELL | Smart money distributing | Exit positions |
| ⬇️ Falling | 📉 Low (below average) | ⚠️ WEAK DECLINE | May reverse soon | Don’t panic sell |
| Flat | Normal | 🟰 NEUTRAL | No clear signal | Wait and watch |
How to Check Volume:
- Look at volume bars below price chart
- Compare today’s volume with previous 5-day average
- Volume surge = Today’s volume > 1.5x average (50% higher)
Example:
- Last 5 days average volume: 10 lakh shares/day
- Today’s volume: 18 lakh shares (1.8x average) ✓ Volume surge!
- Price: Rose 3%
- Verdict: Strong buy signal - Institutions accumulating
Remember: Price can be manipulated, volume harder to fake. Trust moves with volume!
Practical Trading Framework
Combining ALL Indicators for Best Results:
Step-by-Step Analysis Checklist:
1. ✅ Identify Trend
- Check last 5-10 candles
- Determine: Uptrend / Downtrend / Sideways
2. ✅ Mark Support & Resistance
- Find levels where price bounced multiple times
- Note breakout/breakdown points
3. ✅ Check EMA Signals
- Is 5 EMA above or below 13 & 26 EMA?
- Any crossovers recently?
4. ✅ Analyze MACD
- MACD above or below signal line?
- Histogram increasing or decreasing?
5. ✅ Confirm with Volume
- Is volume above 5-day average?
- High volume on up move = Good
- High volume on down move = Bad
6. ✅ Check Candlestick Pattern
- Any reversal patterns (Hammer, Engulfing)?
- Strong body or weak/indecisive?
Signal Scoring System:
| Buy Signals | Sell Signals | Trend | Final Decision |
|---|---|---|---|
| 2+ signals | 0 signals | Uptrend | ⭐ STRONG BUY |
| 1 signal | 0 signals | Not downtrend | ✅ MODERATE BUY |
| 0 signals | 2+ signals | Downtrend | ❌ STRONG SELL |
| 0 signals | 1 signal | Not uptrend | ⚠️ MODERATE SELL |
| Mixed | Mixed | Any | 🟰 HOLD - Wait for clarity |
Example Analysis:
Stock: Infosys
- ✅ Trend: Uptrend (higher highs, higher lows)
- ✅ EMA: 5 EMA crossed above 13 EMA (+1 buy)
- ✅ MACD: Positive and rising (+1 buy)
- ✅ Volume: 150% of average (+1 buy)
- ✅ Candle: Green bullish candle
- ❌ Sell signals: 0
Result: 3 buy signals, 0 sell signals, uptrend → STRONG BUY
Putting It All Together: Holistic Investment Framework
The Complete Analysis Workflow
Your 4-Step Investment Process:
Step 1: Fundamental Screening ✅ or ❌
- Run all 8 Golden Ratios analysis
- Check 5-year trends (Reserves, FCF, EPS growing?)
- Verify sector-specific metrics
- Assess management quality (red flags?)
Decision:
- ✅ Passed → Proceed to Step 2
- ❌ Failed → REJECT - Move to next stock
Step 2: Valuation Analysis 💰
- Calculate intrinsic value using EV/EBITDA method
- Compare company P/E with industry average
- Check Price-to-Book ratio
- Determine target price with 30% margin of safety
Decision:
- ✅ Undervalued (current price < target) → Proceed to Step 3
- ⚠️ Overvalued → WATCHLIST - Wait for price correction
Step 3: Economy & Industry Check 🌍
- GDP growth trajectory (expanding or slowing?)
- Interest rate environment (rates rising/falling?)
- Industry lifecycle stage (growth/maturity/decline?)
- Regulatory environment (favorable/unfavorable?)
Decision:
- ✅ Favorable macro → Proceed to Step 4
- ❌ Unfavorable → DEFER - Wrong timing, wait
Step 4: Technical Entry Timing 📈
- Identify trend (buy only in UPTREND or consolidation)
- Mark support and resistance levels
- Wait for EMA crossover (5 EMA crossing 13/26)
- Confirm with MACD and volume surge
- Use candlestick patterns for precise entry point
- Set STOP LOSS before buying
Decision: ✅ Execute trade with predefined stop loss
Summary: All 4 steps must align for investment. Skip any step = Higher risk!
Risk Management Rules
The Golden Rules:
| Rule | Limit | Why It Matters |
|---|---|---|
| Max Risk Per Trade | 2% of portfolio | One bad trade won’t destroy your capital |
| Max Position Size | 10% per stock | Diversification, one stock can’t sink you |
| Risk-Reward Ratio | Minimum 1:2 | For every ₹1 risked, target ₹2 profit |
Position Sizing Example:
Your Portfolio: ₹10,00,000
Trade Details:
- Entry Price: ₹500
- Stop Loss: ₹475 (5% below entry)
- Risk per share: ₹25
Calculation:
| Step | Calculation | Result |
|---|---|---|
| Max risk allowed | ₹10,00,000 × 2% | ₹20,000 |
| Shares by risk | ₹20,000 ÷ ₹25 | 800 shares |
| Max position value | ₹10,00,000 × 10% | ₹1,00,000 |
| Shares by position limit | ₹1,00,000 ÷ ₹500 | 200 shares |
| ACTUAL shares to buy | Take LOWER of above | 200 shares |
| Investment | 200 × ₹500 | ₹1,00,000 |
| Max loss if SL hit | 200 × ₹25 | ₹5,000 (0.5% of portfolio) ✅ |
Stop Loss Strategies:
| Strategy | Method | Example (Entry ₹500) |
|---|---|---|
| Technical | Below support level | Support at ₹480 → SL at ₹475 |
| Percentage | Fixed % (5-7%) | 7% below → SL at ₹465 |
| ATR-based | Based on volatility | High volatility → Wider SL |
Risk-Reward Calculation:
Given:
- Entry: ₹500
- Stop Loss: ₹475
- Risk: ₹25 per share
Targets:
| Target | Calculation | Price | Reward | Risk:Reward |
|---|---|---|---|---|
| Target 1 | Entry + (Risk × 2) | ₹550 | ₹50 | 1:2 ✅ |
| Target 2 | Entry + (Risk × 3) | ₹575 | ₹75 | 1:3 ⭐ |
Visual:
₹575 ──── Target 2 (+₹75 profit, 1:3)
₹550 ──── Target 1 (+₹50 profit, 1:2)
₹500 ──── Entry Price
₹475 ──── Stop Loss (-₹25 loss)
Rule: Never take a trade where potential loss exceeds potential gain!
Portfolio Construction Principles
Diversification by Market Cap:
| Risk Profile | Large Cap | Mid Cap | Small Cap | Suitable For |
|---|---|---|---|---|
| Conservative | 70% | 20% | 10% | Retirees, low risk tolerance |
| Moderate | 50% | 35% | 15% | Most investors, balanced approach |
| Aggressive | 30% | 40% | 30% | Young investors, high risk appetite |
Example Portfolio: ₹10 Lakhs (Moderate Profile)
| Category | Allocation | Amount | Example Stocks |
|---|---|---|---|
| Large Cap | 50% | ₹5,00,000 | HDFC Bank, Reliance, TCS, Infosys |
| Mid Cap | 35% | ₹3,50,000 | L&T Technology, Mphasis, Persistent |
| Small Cap | 15% | ₹1,50,000 | High growth smallcaps (2-3 stocks max) |
Portfolio Guidelines:
| Parameter | Recommended Value | Why |
|---|---|---|
| Number of stocks | 10-15 stocks | Optimal diversification without over-diversification |
| Max per stock | 10% of portfolio | No single stock risk |
| Max per sector | 25% of portfolio | Sector risk mitigation |
| Review frequency | Quarterly | Track performance, rebalance if needed |
Sector Diversification Example (₹10L Portfolio):
| Sector | Allocation | Max Amount |
|---|---|---|
| Banking/Finance | 25% | ₹2,50,000 |
| IT/Technology | 20% | ₹2,00,000 |
| FMCG | 15% | ₹1,50,000 |
| Pharma | 15% | ₹1,50,000 |
| Auto/Manufacturing | 15% | ₹1,50,000 |
| Others | 10% | ₹1,00,000 |
Remember: Don’t put all eggs in one basket. Diversify, but don’t over-diversify!
Key Principles Summary
Fundamental Analysis Commandments:
- Quality Over Quantity: Own 10-15 well-researched stocks, not 50 random picks
- Circle of Competence: Invest only in businesses you understand
- Management Matters: Honest management with skin in the game is non-negotiable
- Margin of Safety: Buy at significant discount to intrinsic value
- Long-term Horizon: Compounding requires patience - minimum 3-5 years
Technical Analysis Commandments:
- Trend is Friend: Only buy in uptrends, only short in downtrends
- Volume Confirms Price: Price movements without volume are suspect
- Support Becomes Resistance: Levels flip roles after breaks
- Multiple Timeframe Alignment: Higher probability when all timeframes agree
- Stop Losses Are Mandatory: Never trade without predefined exit
Risk Management Commandments:
- Never Risk More Than 2%: Per trade portfolio risk limit
- Position Sizing Discipline: No single stock above 10% of portfolio
- Cut Losses Quickly: Stop loss hit = Exit immediately, no hoping
- Let Winners Run: Trail stop losses on profitable positions
- Diversify Across Sectors: No sector above 25% portfolio weight
Advanced Concepts and Nuances
IPO Analysis Framework
Beyond regular fundamental analysis, IPOs need special scrutiny:
IPO Evaluation Checklist:
| Parameter | Green Flag ✅ | Red Flag ❌ | Why It Matters |
|---|---|---|---|
| OFS vs Fresh Issue | Fresh Issue > 50% | OFS > 50% | Fresh = Growth capital, OFS = Promoters exiting |
| Grey Market Premium | GMP > 20% above upper band | GMP < 0 (discount) | Indicates market demand |
| Retail Subscription | RII > 3x subscribed | RII < 1x | Retail investor interest |
| QIB Subscription | QIB > 1x | QIB < 1x | Institutional confidence |
| P/E vs Industry | Company P/E < Industry P/E | Company P/E > Industry P/E | Valuation attractiveness |
| Min Subscription | Total > 90% | Total < 90% | Will it list? |
Scoring System:
| Green Flags | Red Flags | Verdict | Action |
|---|---|---|---|
| 4-6 | 0-1 | ⭐ STRONG | Apply for maximum shares |
| 2-3 | 1-2 | ⚠️ MODERATE | Small allocation, risky |
| 0-1 | 3+ | ❌ AVOID | Don’t apply, too many concerns |
Real Example: Zomato IPO
- ✅ Fresh Issue: 60% (raising growth capital)
- ✅ GMP: ₹50 premium (strong demand)
- ✅ RII: 7.45x (retail crazy about it)
- ✅ QIB: 51.79x (institutions love it)
- ⚠️ P/E: Loss-making (no comparison possible)
- ✅ Subscription: 38x overall
Score: 4-5 green flags → APPLY (and it listed at good premium!)
Book Value and Asset Plays
Book Value = What shareholders would get if company sold everything and paid all debts
Formula: Book Value = (Total Assets - External Liabilities) ÷ Total Shares
Calculation Example:
| Component | Amount (₹ Cr) |
|---|---|
| Current Assets | 5,000 |
| Non-Current Assets | 15,000 |
| Total Assets | 20,000 |
| Current Liabilities | 3,000 |
| Non-Current Liabilities | 7,000 |
| Total Liabilities | 10,000 |
| Book Value (Assets - Liabilities) | 10,000 |
| Total Outstanding Shares | 100 Cr |
| Book Value per Share | ₹100 |
Price to Book (P/B) Ratio:
| P/B Ratio | Market Price | Interpretation |
|---|---|---|
| < 1 | ₹80 (below ₹100 BV) | Trading below book - Distressed or value opportunity |
| 1-3 | ₹150 (1.5x BV) | Reasonable valuation for assets |
| > 3 | ₹400 (4x BV) | Premium - Growth/brand value priced in |
When Book Value Matters:
- Asset-heavy businesses: Real estate, manufacturing, infrastructure
- Banks: P/B ratio more relevant than P/E
- Distressed situations: Bankruptcy, asset sales
When Book Value Doesn’t Matter:
- IT/Services: No physical assets, all intellectual property
- Growth companies: Future potential > Current assets
- Consumer brands: Brand value not on balance sheet
Example: Page Industries (Jockey brand) trades at 20+ P/B because brand value >> physical assets!
Behavioral Pitfalls to Avoid
Your worst enemy in markets? YOUR OWN BRAIN! Here are common biases:
1. Recency Bias - Overweighting recent performance
| Situation | Bias | Reality Check |
|---|---|---|
| Won 4 out of last 5 trades | “I’m a genius! Can’t lose!” | ⚠️ Overconfidence leads to bigger bets → Bigger losses |
| Lost last 3 trades | “I’m terrible at this!” | ⚠️ Small sample, doesn’t define skill |
Action: Track 50+ trades before judging your skill. Stay disciplined regardless of recent results.
2. Loss Aversion - Holding losers too long, selling winners too early
| Scenario | Emotional Response | Rational Action |
|---|---|---|
| Stock at ₹100, now ₹80 (20% loss) | “Can’t sell at loss, will hold till breakeven” | ❌ Exit at stop loss, capital can work elsewhere |
| Stock at ₹100, now ₹120 (20% profit) | “Better book profit before it falls!” | ✅ OK to book, but let winners run with trailing SL |
Rule: Cut losses quickly, let profits run. Don’t marry your losers!
3. Herd Mentality (FOMO) - Buying because everyone else is
| Red Flag | What You See | What You Should Do |
|---|---|---|
| Stock all over Twitter/WhatsApp | “Everyone’s buying, I’ll miss out!” | 🛑 STOP! Do independent analysis |
| “Hot tip” from 5 different people | “Must be true if everyone says it” | 🛑 Usually means you’re late |
| Social media mentions 3x normal | Extreme hype | 🛑 Often marks the top |
Real Example: When your barber gives you stock tips, market top is near!
4. Anchoring - Fixating on past price levels
| Anchor Point | Biased Thinking | Reality |
|---|---|---|
| Stock at ₹200 (52W high), now ₹100 | “It’s cheap! Was ₹200!” | ❌ Maybe business deteriorated, ₹100 is fair |
| Bought at ₹150, now ₹120 | “Won’t sell till ₹150” | ❌ Your buy price is irrelevant to market |
| IPO price ₹100, trading ₹80 | “Will go back to ₹100” | ❌ Market doesn’t care about IPO price |
Truth: Analyze CURRENT fundamentals, not past prices. Market doesn’t remember your cost!
Self-Check Questions:
Before ANY trade, ask yourself:
- ❓ Am I buying because of analysis or emotions?
- ❓ Would I buy more if everyone was selling it?
- ❓ Would I sell some if everyone was selling it?
- ❓ Is my overconfidence from a few lucky wins?
Be honest. Your portfolio will thank you!
Continuous Learning Resources
The journey of mastering equity markets involves continuous learning and adaptation. Here are critical practices:
1. Daily Habits:
- Read financial newspapers (Economic Times, Business Standard)
- Track key indices and sector movements
- Review your portfolio and update watchlists
- Journal all trades with reasoning and emotions
2. Weekly Rituals:
- Analyze quarterly results of portfolio companies
- Screen for new investment opportunities
- Review technical charts on weekly timeframe
- Calculate portfolio returns and risk metrics
3. Monthly Discipline:
- Read annual reports of target companies
- Attend investor conference calls
- Rebalance portfolio if needed
- Review and learn from past mistakes
4. Continuous Education:
- Follow quality content creators (as referenced in the fundamentals)
- Study case studies of successful investors
- Understand macroeconomic indicators deeply
- Keep updating valuation models with new data
Final Thoughts: The Investing Mindset
This comprehensive exploration of equity markets provides the foundation for building wealth through equities. Key principles to internalize:
1. Analysis Over Emotion: Every investment decision must stem from rigorous analysis, not tips, FOMO, or greed.
2. Patience Compounds Wealth: The real money is made by holding quality businesses for years, not trading frequently.
3. Risk Management is Everything: Capital preservation comes before capital appreciation - you can’t compound if you blow up.
4. Continuous Learning: Markets evolve, businesses change, regulations shift - stay curious and adaptive.
5. Know What You Own: If you can’t explain why you own a stock, you shouldn’t own it.
6. Humility: The market is supreme. When proven wrong, accept it quickly and move on.
The difference between gambling and investing lies not in the assets themselves, but in your approach. Armed with fundamental analysis for selection, technical analysis for timing, you can expect to make money in the long run.